

Your graphics add a nice touch to my presentations and I recently used them for one of my all-hands meetings. Your toolbox adds professionalism to my slides. Instead of using standard clipart.
Claude Jones, Director of Engineer, @Walmartlabs, USA

Your graphics add a nice touch to my presentations and I recently used them for one of my all-hands meetings. Your toolbox adds professionalism to my slides. Instead of using standard clipart.
Claude Jones, Director of Engineer, @Walmartlabs, USA
I needed a fresh look at some of my slides. I've tried to find a way to create a paintbrush effect, to underline, accentuate, add some color and the handwritten markers were just the things. Very easy to use, easy to size, change the color. It was an affordable, perfect solution and I'm happy to recommend it.
Anonymous, US
The crisp, clean look of the graphics, and the fact that it allowed me to easily edit and change the colors to match the template was my main reason for purchasing them.
Brandie Jenkins, E-learning Developer, USA
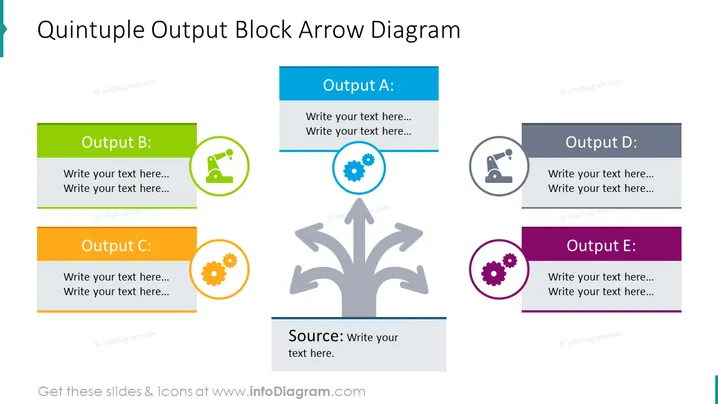
This PowerPoint slide, titled "Quintuple Output Block Arrow Diagram," features a central graphic showcasing one source leading to five distinct outputs. Each output—labeled from A to E—is associated with a unique color and icon, encouraging the viewer to insert relevant text for each component. Output A in blue is placed at the top, followed by Output B in green and Output C in orange to the left and right. Output D in gray and Output E in purple are positioned on the lower right and left sides, respectively. Each output block is designed to elaborate on different outcomes or results derived from the central source.
The overall graphical look of the slide is professional, employing a symmetrical layout that effectively conveys a central source branching out into multiple outputs. The color-coding and icons aid visual differentiation and emphasize the distribution of outputs from the main source.



