
Your graphics add a nice touch to my presentations and I recently used them for one of my all-hands meetings. Your toolbox adds professionalism to my slides. Instead of using standard clipart.
Claude Jones, Director of Engineer, @Walmartlabs, USA
Your graphics add a nice touch to my presentations and I recently used them for one of my all-hands meetings. Your toolbox adds professionalism to my slides. Instead of using standard clipart.
Claude Jones, Director of Engineer, @Walmartlabs, USA
I needed a fresh look at some of my slides. I've tried to find a way to create a paintbrush effect, to underline, accentuate, add some color and the handwritten markers were just the things. Very easy to use, easy to size, change the color. It was an affordable, perfect solution and I'm happy to recommend it.
Anonymous, US
The crisp, clean look of the graphics, and the fact that it allowed me to easily edit and change the colors to match the template was my main reason for purchasing them.
Brandie Jenkins, E-learning Developer, USA
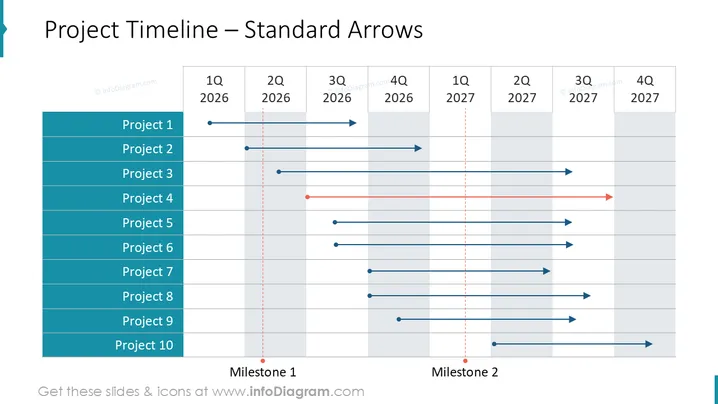
The slide is a timeline visualization for project management showing the progress of 10 individual projects across quarters from Q1 2025 to Q4 2026. Each project is listed vertically along the left side, and the corresponding time spans are indicated with horizontal arrows pointing right, toward the future. Two milestones are marked across the timeline. The use of different arrow colors indicates varying progress or phases for some of the projects, while blue dots and red vertical dotted lines signify the start of a project and the milestones, respectively.
The slide has a structured and formal design, with a clear visual hierarchy that guides the viewer through the timeline effectively. The choice of colors and simple geometric shapes ensures that the project data is easy to interpret and compare.




