

Your graphics add a nice touch to my presentations and I recently used them for one of my all-hands meetings. Your toolbox adds professionalism to my slides. Instead of using standard clipart.
Claude Jones, Director of Engineer, @Walmartlabs, USA

Your graphics add a nice touch to my presentations and I recently used them for one of my all-hands meetings. Your toolbox adds professionalism to my slides. Instead of using standard clipart.
Claude Jones, Director of Engineer, @Walmartlabs, USA
I needed a fresh look at some of my slides. I've tried to find a way to create a paintbrush effect, to underline, accentuate, add some color and the handwritten markers were just the things. Very easy to use, easy to size, change the color. It was an affordable, perfect solution and I'm happy to recommend it.
Anonymous, US
The crisp, clean look of the graphics, and the fact that it allowed me to easily edit and change the colors to match the template was my main reason for purchasing them.
Brandie Jenkins, E-learning Developer, USA
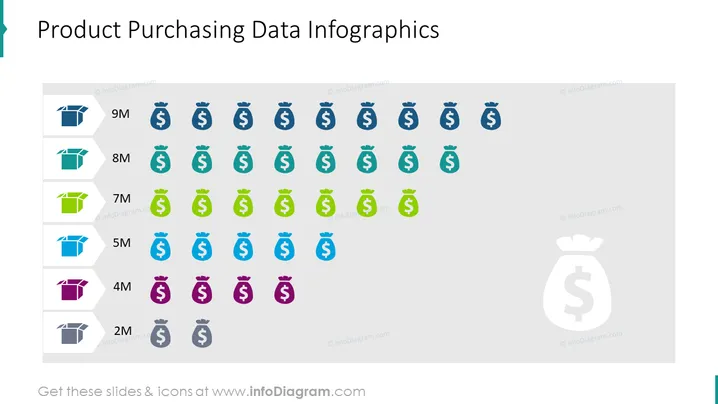
The slide depicts purchasing data for products, with icons representing products and money bags signifying sales in millions. Progressively, from the bottom to top, the amount of products purchased increases as indicated by more money bag icons. For instance, 2M signifies two million, accompanied by fewer product and money bag icons, while higher figures like 9M feature a proportionally greater number of icons, visually representing more significant purchasing data.
The slide has a minimalistic yet informative design guiding the viewer through a visual representation of product purchasing data. The color-coded icons and the stepped layout contribute to a clear understanding of the sales volume associated with each product category or level.



