

Your graphics add a nice touch to my presentations and I recently used them for one of my all-hands meetings. Your toolbox adds professionalism to my slides. Instead of using standard clipart.
Claude Jones, Director of Engineer, @Walmartlabs, USA

Your graphics add a nice touch to my presentations and I recently used them for one of my all-hands meetings. Your toolbox adds professionalism to my slides. Instead of using standard clipart.
Claude Jones, Director of Engineer, @Walmartlabs, USA
I needed a fresh look at some of my slides. I've tried to find a way to create a paintbrush effect, to underline, accentuate, add some color and the handwritten markers were just the things. Very easy to use, easy to size, change the color. It was an affordable, perfect solution and I'm happy to recommend it.
Anonymous, US
The crisp, clean look of the graphics, and the fact that it allowed me to easily edit and change the colors to match the template was my main reason for purchasing them.
Brandie Jenkins, E-learning Developer, USA
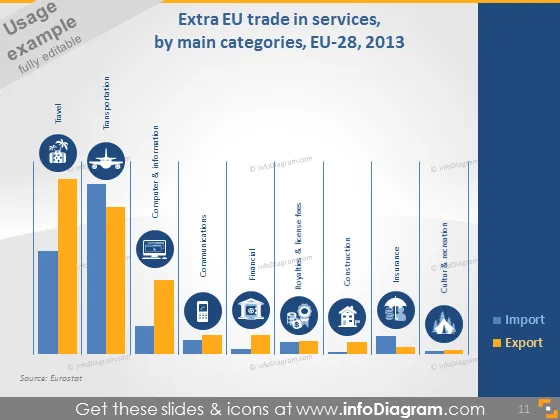
The slide is titled "Extra EU trade in services, by main categories, EU-28, 2013" and showcases a bar chart juxtaposing import and export figures across eight service categories: Travel, Computer & Information, Communications, Financial, Royalties & License Fees, Other Business Services, Construction, and Culture & Recreation. Travel and Other Business Services seem to have the highest bars, indicating these categories might have the largest volume in trade, while Culture & Recreation and Construction have the lowest, suggesting lesser trade volumes.
The overall look of the slide is professional and clean, with a good use of color contrast to differentiate between imports and exports. The use of relevant icons adds a visual cue to swiftly identify the service categories.



