

Your graphics add a nice touch to my presentations and I recently used them for one of my all-hands meetings. Your toolbox adds professionalism to my slides. Instead of using standard clipart.
Claude Jones, Director of Engineer, @Walmartlabs, USA

Your graphics add a nice touch to my presentations and I recently used them for one of my all-hands meetings. Your toolbox adds professionalism to my slides. Instead of using standard clipart.
Claude Jones, Director of Engineer, @Walmartlabs, USA
I needed a fresh look at some of my slides. I've tried to find a way to create a paintbrush effect, to underline, accentuate, add some color and the handwritten markers were just the things. Very easy to use, easy to size, change the color. It was an affordable, perfect solution and I'm happy to recommend it.
Anonymous, US
The crisp, clean look of the graphics, and the fact that it allowed me to easily edit and change the colors to match the template was my main reason for purchasing them.
Brandie Jenkins, E-learning Developer, USA
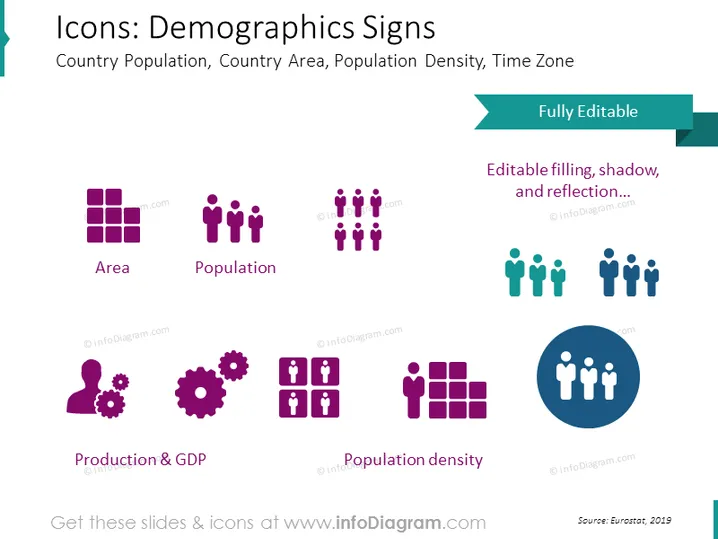
The PowerPoint slide is titled "Icons: Demographics Signs" and features various graphical icons representing demographic metrics such as Country Population, Country Area, Population Density, and Time Zone. Each icon is labeled with a facilitating concept: "Area" showing a grid representing a plot of land; "Population" depicted with a group of people; "Production & GDP" using gears and a head silhouette, symbolizing industry and intellect; "Population density" illustrated with tightly packed human figures, conveying the concept of people per unit area.
The slide has a modern and straightforward design that focuses on visualizing demographic concepts with clear icons and text. The use of color is limited, featuring mainly purple and teal, providing consistency and visual appeal.



