

Your graphics add a nice touch to my presentations and I recently used them for one of my all-hands meetings. Your toolbox adds professionalism to my slides. Instead of using standard clipart.
Claude Jones, Director of Engineer, @Walmartlabs, USA

Your graphics add a nice touch to my presentations and I recently used them for one of my all-hands meetings. Your toolbox adds professionalism to my slides. Instead of using standard clipart.
Claude Jones, Director of Engineer, @Walmartlabs, USA
I needed a fresh look at some of my slides. I've tried to find a way to create a paintbrush effect, to underline, accentuate, add some color and the handwritten markers were just the things. Very easy to use, easy to size, change the color. It was an affordable, perfect solution and I'm happy to recommend it.
Anonymous, US
The crisp, clean look of the graphics, and the fact that it allowed me to easily edit and change the colors to match the template was my main reason for purchasing them.
Brandie Jenkins, E-learning Developer, USA
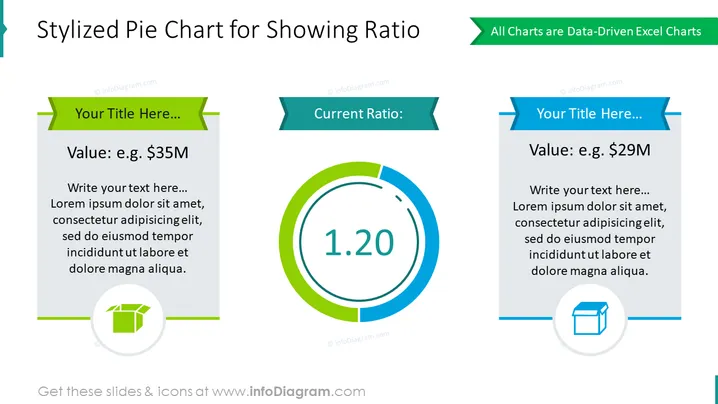
This PowerPoint slide presents a visual comparison of two values using a stylized pie chart format to show a ratio. On the left, there is a placeholder for a value, exemplified as "$35M", with an accompanying explanatory text area. On the right, another value is suggested, "$29M", with similar space for elaboration. The centerpiece exhibits a large pie chart with "1.20" signifying the current ratio, providing a simple and immediate visual comparison of the two values, illustrating their proportional relationship.
The slide is characterized by a clean and symmetrical layout with a professional color scheme, focused on clarity and easy comparison of data. The use of bold numbers and text in the central pie chart graphic draws attention immediately to the key data point.



