

Your graphics add a nice touch to my presentations and I recently used them for one of my all-hands meetings. Your toolbox adds professionalism to my slides. Instead of using standard clipart.
Claude Jones, Director of Engineer, @Walmartlabs, USA

Your graphics add a nice touch to my presentations and I recently used them for one of my all-hands meetings. Your toolbox adds professionalism to my slides. Instead of using standard clipart.
Claude Jones, Director of Engineer, @Walmartlabs, USA
I needed a fresh look at some of my slides. I've tried to find a way to create a paintbrush effect, to underline, accentuate, add some color and the handwritten markers were just the things. Very easy to use, easy to size, change the color. It was an affordable, perfect solution and I'm happy to recommend it.
Anonymous, US
The crisp, clean look of the graphics, and the fact that it allowed me to easily edit and change the colors to match the template was my main reason for purchasing them.
Brandie Jenkins, E-learning Developer, USA
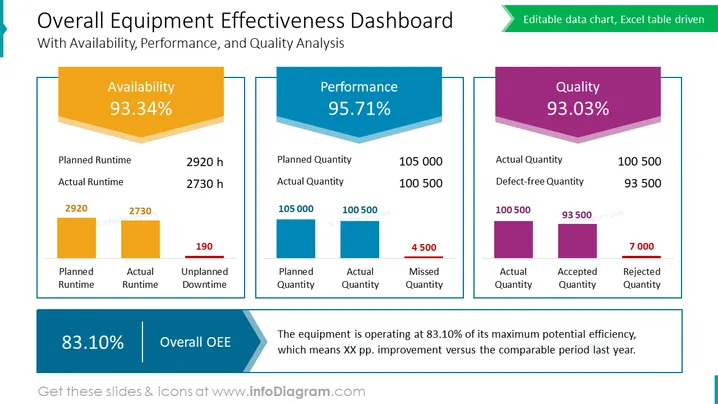
The slide presents an "Overall Equipment Effectiveness Dashboard" highlighting metrics for "Availability," "Performance," and "Quality" with percentages of 93.34%, 95.71%, and 93.03% respectively. Each metric includes a deeper analysis with bar graphs showing planned vs. actual values, and in the case of quality, accepted vs. rejected quantities. The metrics are indicative of a manufacturing or production environment. The overall OEE is summarized at 83.10%, with a note explaining that the equipment operates at 83.10% of its maximum potential efficiency and indicates an improvement over the last year.
The slide design is clean and professionally structured, with a strong visual hierarchy that guides the viewer through the key performance indicators. The color coding and three-dimensional bar charts make for a visually appealing presentation that can be easily understood at a glance.



