
Your graphics add a nice touch to my presentations and I recently used them for one of my all-hands meetings. Your toolbox adds professionalism to my slides. Instead of using standard clipart.
Claude Jones, Director of Engineer, @Walmartlabs, USA

Your graphics add a nice touch to my presentations and I recently used them for one of my all-hands meetings. Your toolbox adds professionalism to my slides. Instead of using standard clipart.
Claude Jones, Director of Engineer, @Walmartlabs, USA

I needed a fresh look at some of my slides. I've tried to find a way to create a paintbrush effect, to underline, accentuate, add some color and the handwritten markers were just the things. Very easy to use, easy to size, change the color. It was an affordable, perfect solution and I'm happy to recommend it.
Anonymous, US
The crisp, clean look of the graphics, and the fact that it allowed me to easily edit and change the colors to match the template was my main reason for purchasing them.
Brandie Jenkins, E-learning Developer, USA
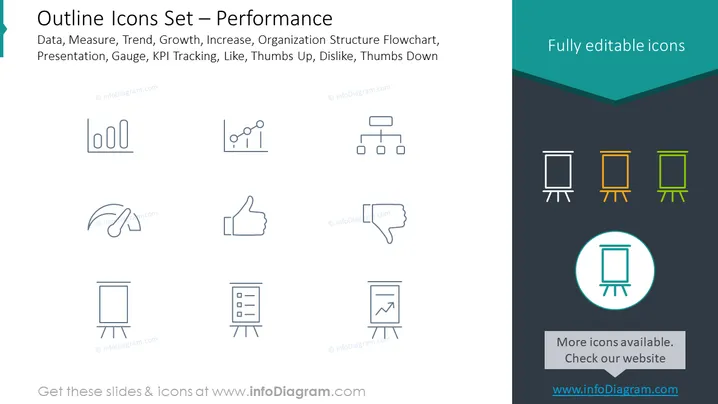
The PowerPoint slide presents a collection of outline icons related to performance metrics and tools. It includes icons that represent Data, Measure, Trend, Growth, Increase, and Organization Structure Flowchart. There are also icons for Presentation, Gauge, KPI Tracking, and user feedback with icons for Like, Thumbs Up, Dislike, and Thumbs Down. Each icon visualizes a concept important for business analysis and feedback sessions, measuring different aspects of performance and growth, depicting organizational hierarchy, or capturing audience sentiment.
The slide is visually balanced and employs a professional and modern aesthetic. The use of space and alignment creates an organized presentation of the icons, with a focus on simplicity and readability.


