

Your graphics add a nice touch to my presentations and I recently used them for one of my all-hands meetings. Your toolbox adds professionalism to my slides. Instead of using standard clipart.
Claude Jones, Director of Engineer, @Walmartlabs, USA

Your graphics add a nice touch to my presentations and I recently used them for one of my all-hands meetings. Your toolbox adds professionalism to my slides. Instead of using standard clipart.
Claude Jones, Director of Engineer, @Walmartlabs, USA
I needed a fresh look at some of my slides. I've tried to find a way to create a paintbrush effect, to underline, accentuate, add some color and the handwritten markers were just the things. Very easy to use, easy to size, change the color. It was an affordable, perfect solution and I'm happy to recommend it.
Anonymous, US
The crisp, clean look of the graphics, and the fact that it allowed me to easily edit and change the colors to match the template was my main reason for purchasing them.
Brandie Jenkins, E-learning Developer, USA
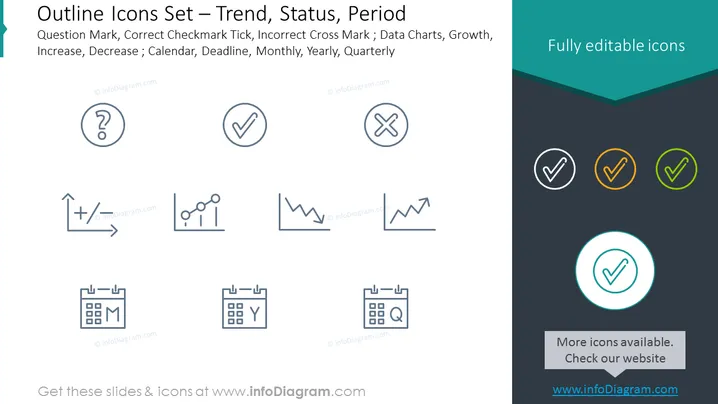
This PowerPoint slide is titled 'Outline Icons Set – Trend, Status, Period' and features a collection of icons representing various concepts. The question mark symbolizes inquiry or uncertainty. The correct checkmark tick and incorrect cross mark represent approval and disapproval or error, respectively. Data charts with upward and downward trends signify growth and decrease. Calendar icons with 'M', 'Y', and 'Q' denote monthly, yearly, and quarterly timeframes, reflecting different periods for planning or reviewing.
The design is minimalist and focused on conveying the symbols' meaning quickly to the viewer. The use of color is restrained, with emphasis on the icons within the dark header through contrasting colors.



