

Your graphics add a nice touch to my presentations and I recently used them for one of my all-hands meetings. Your toolbox adds professionalism to my slides. Instead of using standard clipart.
Claude Jones, Director of Engineer, @Walmartlabs, USA

Your graphics add a nice touch to my presentations and I recently used them for one of my all-hands meetings. Your toolbox adds professionalism to my slides. Instead of using standard clipart.
Claude Jones, Director of Engineer, @Walmartlabs, USA
I needed a fresh look at some of my slides. I've tried to find a way to create a paintbrush effect, to underline, accentuate, add some color and the handwritten markers were just the things. Very easy to use, easy to size, change the color. It was an affordable, perfect solution and I'm happy to recommend it.
Anonymous, US
The crisp, clean look of the graphics, and the fact that it allowed me to easily edit and change the colors to match the template was my main reason for purchasing them.
Brandie Jenkins, E-learning Developer, USA
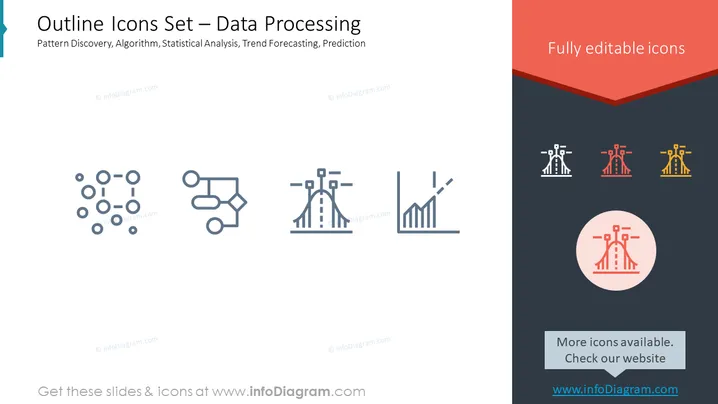
The slide presents a set of outline icons related to data processing. The icons represent various aspects of analytics and predictive modelling, including Pattern Discovery (identifying recurring patterns within data), Algorithm (structured sets of instructions), Statistical Analysis (application of statistical methods to data), Trend Forecasting (predicting future trends based on data), and Prediction (making informed guesses about future events).
The slide utilizes a modern and clean design, with sufficient contrast between text, icons, and the background to ensure readability. The icons are minimalist and convey the intended concepts effectively.



