

Your graphics add a nice touch to my presentations and I recently used them for one of my all-hands meetings. Your toolbox adds professionalism to my slides. Instead of using standard clipart.
Claude Jones, Director of Engineer, @Walmartlabs, USA

Your graphics add a nice touch to my presentations and I recently used them for one of my all-hands meetings. Your toolbox adds professionalism to my slides. Instead of using standard clipart.
Claude Jones, Director of Engineer, @Walmartlabs, USA
I needed a fresh look at some of my slides. I've tried to find a way to create a paintbrush effect, to underline, accentuate, add some color and the handwritten markers were just the things. Very easy to use, easy to size, change the color. It was an affordable, perfect solution and I'm happy to recommend it.
Anonymous, US
The crisp, clean look of the graphics, and the fact that it allowed me to easily edit and change the colors to match the template was my main reason for purchasing them.
Brandie Jenkins, E-learning Developer, USA
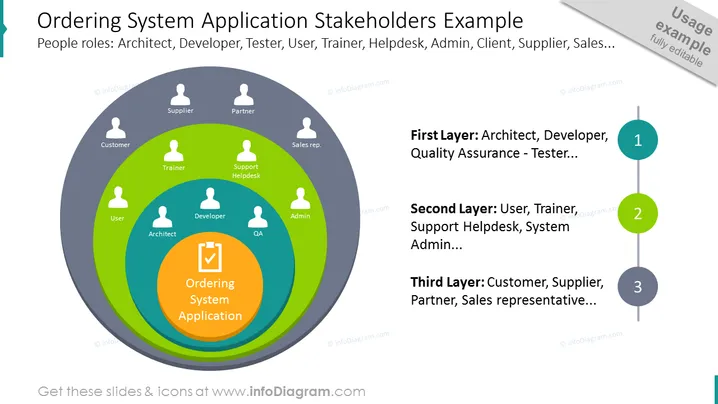
##Slide content: Infographic slide with ordering system application stakeholders example. The people’s roles are presented with a layer diagram. In the core layer, we have the order system application, then, the first layer consists of people directly involved in producing, such as the architect, developer, and QA. The second layer shows the user, trainer, support helpdesk, and admin, and the outer layer – the customer, supplier, partner, and sales representative. On the right-hand side, we left a space for a short description, where you can name the persons and institutions concerned in each layer. Click on the picture to see more stakeholder analysis infographic ideas.
##Slide infographic description: Onion Diagram, Man Outline Icon, Color Coding, Checklist Outline Icon, Line Vector, Touch Points, Flat Outline Enumeration Icon



