
Your graphics add a nice touch to my presentations and I recently used them for one of my all-hands meetings. Your toolbox adds professionalism to my slides. Instead of using standard clipart.
Claude Jones, Director of Engineer, @Walmartlabs, USA

Your graphics add a nice touch to my presentations and I recently used them for one of my all-hands meetings. Your toolbox adds professionalism to my slides. Instead of using standard clipart.
Claude Jones, Director of Engineer, @Walmartlabs, USA

I needed a fresh look at some of my slides. I've tried to find a way to create a paintbrush effect, to underline, accentuate, add some color and the handwritten markers were just the things. Very easy to use, easy to size, change the color. It was an affordable, perfect solution and I'm happy to recommend it.
Anonymous, US
The crisp, clean look of the graphics, and the fact that it allowed me to easily edit and change the colors to match the template was my main reason for purchasing them.
Brandie Jenkins, E-learning Developer, USA
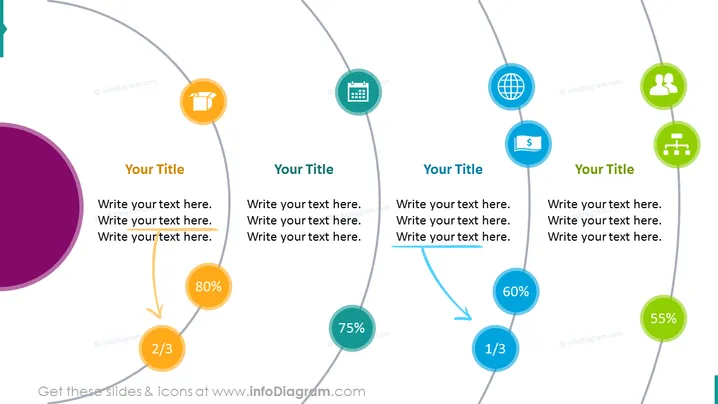
The slide appears to convey the progression or status of multiple tasks or objectives, as indicated by the percentage figures. Each "Your Title" section presumably represents a different category or phase of a project, with space provided underneath to write a descriptive text. The percentage figures (80%, 75%, 60%, and 55%) might represent completion levels, with accompanying icons suggesting a connection to specific tasks like chart analysis, calendaring, global operations, financial performance, and logistics.
The slide has a clean, modern aesthetic with a harmonious color palette that uses contrasting shades to delineate different elements. The graphical elements suggest a cohesive process flow or progression, with visual cues to highlight measurements and specific process steps or aspects.


