

Your graphics add a nice touch to my presentations and I recently used them for one of my all-hands meetings. Your toolbox adds professionalism to my slides. Instead of using standard clipart.
Claude Jones, Director of Engineer, @Walmartlabs, USA

Your graphics add a nice touch to my presentations and I recently used them for one of my all-hands meetings. Your toolbox adds professionalism to my slides. Instead of using standard clipart.
Claude Jones, Director of Engineer, @Walmartlabs, USA
I needed a fresh look at some of my slides. I've tried to find a way to create a paintbrush effect, to underline, accentuate, add some color and the handwritten markers were just the things. Very easy to use, easy to size, change the color. It was an affordable, perfect solution and I'm happy to recommend it.
Anonymous, US
The crisp, clean look of the graphics, and the fact that it allowed me to easily edit and change the colors to match the template was my main reason for purchasing them.
Brandie Jenkins, E-learning Developer, USA
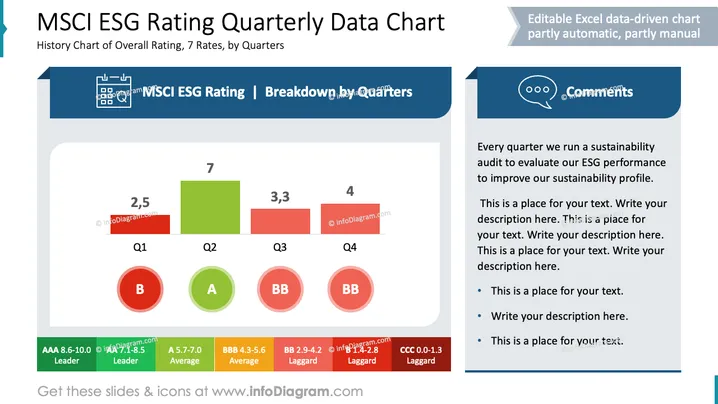
The slide illustrates the "MSCI ESG Rating Quarterly Data Chart," detailing the history of overall ratings through seven rates by quarters. It includes a quarterly score representation from Q1 to Q4, displaying a significant increase in Q2. The commentary section provides a placeholder for analyzing ESG performance metrics, aiming to enhance sustainability profiles over time. A ratings legend classifies grades from 'AAA' (Leader) to 'CCC' (Laggard).
The slide is neatly organized with visually distinct sections. The use of colors corresponds effectively with the rating scale, enhancing clarity.



