

Your graphics add a nice touch to my presentations and I recently used them for one of my all-hands meetings. Your toolbox adds professionalism to my slides. Instead of using standard clipart.
Claude Jones, Director of Engineer, @Walmartlabs, USA

Your graphics add a nice touch to my presentations and I recently used them for one of my all-hands meetings. Your toolbox adds professionalism to my slides. Instead of using standard clipart.
Claude Jones, Director of Engineer, @Walmartlabs, USA
I needed a fresh look at some of my slides. I've tried to find a way to create a paintbrush effect, to underline, accentuate, add some color and the handwritten markers were just the things. Very easy to use, easy to size, change the color. It was an affordable, perfect solution and I'm happy to recommend it.
Anonymous, US
The crisp, clean look of the graphics, and the fact that it allowed me to easily edit and change the colors to match the template was my main reason for purchasing them.
Brandie Jenkins, E-learning Developer, USA
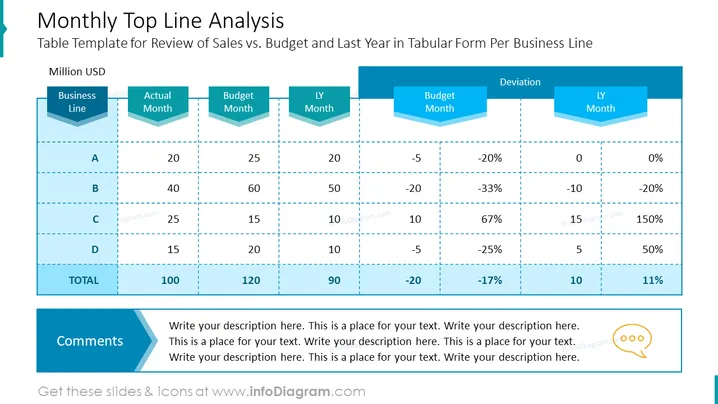
This slide titled 'Monthly Top Line Analysis' presents a table template for reviewing sales versus budget and last year in tabular form by business line. The table lists four business lines (A, B, C, D), comparing their actual and budgeted sales for a month, sales from the same month of the previous year (LY Month), and calculating the deviations between actual and budget, and actual versus last year. These deviations are given in both raw figures and percentages, offering insights into business performance and areas that may require attention.
The slide utilizes a crisp, professional color scheme dominated by shades of blue, conveying a sense of trustworthiness and stability. The use of 3D effects and color-coded columns adds depth and focus to the data presentation.



