

Your graphics add a nice touch to my presentations and I recently used them for one of my all-hands meetings. Your toolbox adds professionalism to my slides. Instead of using standard clipart.
Claude Jones, Director of Engineer, @Walmartlabs, USA

Your graphics add a nice touch to my presentations and I recently used them for one of my all-hands meetings. Your toolbox adds professionalism to my slides. Instead of using standard clipart.
Claude Jones, Director of Engineer, @Walmartlabs, USA
I needed a fresh look at some of my slides. I've tried to find a way to create a paintbrush effect, to underline, accentuate, add some color and the handwritten markers were just the things. Very easy to use, easy to size, change the color. It was an affordable, perfect solution and I'm happy to recommend it.
Anonymous, US
The crisp, clean look of the graphics, and the fact that it allowed me to easily edit and change the colors to match the template was my main reason for purchasing them.
Brandie Jenkins, E-learning Developer, USA
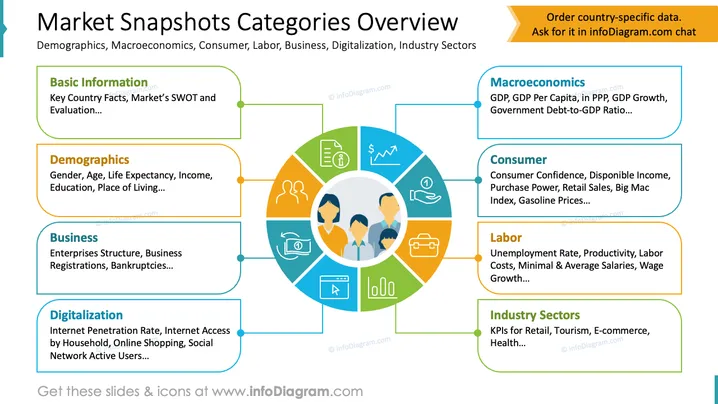
This slide presents an overview of market snapshot categories, which cover key aspects of demographics, macroeconomics, consumer habits, labor markets, business operations, digitalization, and industry sectors. Basic Information outlines essential country facts and SWOT analysis. Demographics include age, gender, and living standards. Macroeconomics covers GDP details and government debt. Consumer information focuses on spending and pricing indexes. Labor concerns wage and productivity metrics. Business examines entity structures and bankruptcy. Digitalization emphasizes internet usage trends. Industry Sectors highlight key performance indicators for retail and health.
The slide offers a clear and colorful visualization of complex market data categories, using structured layouts and compelling icons to convey information concisely.



