

Your graphics add a nice touch to my presentations and I recently used them for one of my all-hands meetings. Your toolbox adds professionalism to my slides. Instead of using standard clipart.
Claude Jones, Director of Engineer, @Walmartlabs, USA

Your graphics add a nice touch to my presentations and I recently used them for one of my all-hands meetings. Your toolbox adds professionalism to my slides. Instead of using standard clipart.
Claude Jones, Director of Engineer, @Walmartlabs, USA
I needed a fresh look at some of my slides. I've tried to find a way to create a paintbrush effect, to underline, accentuate, add some color and the handwritten markers were just the things. Very easy to use, easy to size, change the color. It was an affordable, perfect solution and I'm happy to recommend it.
Anonymous, US
The crisp, clean look of the graphics, and the fact that it allowed me to easily edit and change the colors to match the template was my main reason for purchasing them.
Brandie Jenkins, E-learning Developer, USA
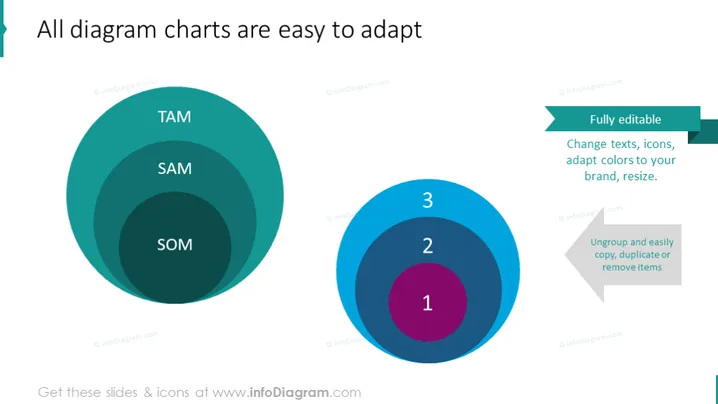
The slide seems to be part of a presentation about the adaptability of diagram charts. It highlights that diagram charts are not just easy to adapt but are fully editable, meaning one can change texts, icons, adapt colors to match one's brand and resize elements. There's also an emphasis on the ability to ungroup and easily copy, duplicate, or remove items, which suggests that the charts are meant to be user-friendly and customizable for various presentation needs. The visual examples include concentric circles labeled TAM, SAM, and SOM, and a segmented circle numbered 1, 2, and 3, demonstrating how the elements can be visually manipulated.
The slide is clean and modern with a simple colour scheme that emphasizes the adaptability of the diagrams. The use of concentric circles and numbered segments provides a visual representation of how the diagrams can represent different concepts or data sets.



