

Your graphics add a nice touch to my presentations and I recently used them for one of my all-hands meetings. Your toolbox adds professionalism to my slides. Instead of using standard clipart.
Claude Jones, Director of Engineer, @Walmartlabs, USA

Your graphics add a nice touch to my presentations and I recently used them for one of my all-hands meetings. Your toolbox adds professionalism to my slides. Instead of using standard clipart.
Claude Jones, Director of Engineer, @Walmartlabs, USA
I needed a fresh look at some of my slides. I've tried to find a way to create a paintbrush effect, to underline, accentuate, add some color and the handwritten markers were just the things. Very easy to use, easy to size, change the color. It was an affordable, perfect solution and I'm happy to recommend it.
Anonymous, US
The crisp, clean look of the graphics, and the fact that it allowed me to easily edit and change the colors to match the template was my main reason for purchasing them.
Brandie Jenkins, E-learning Developer, USA
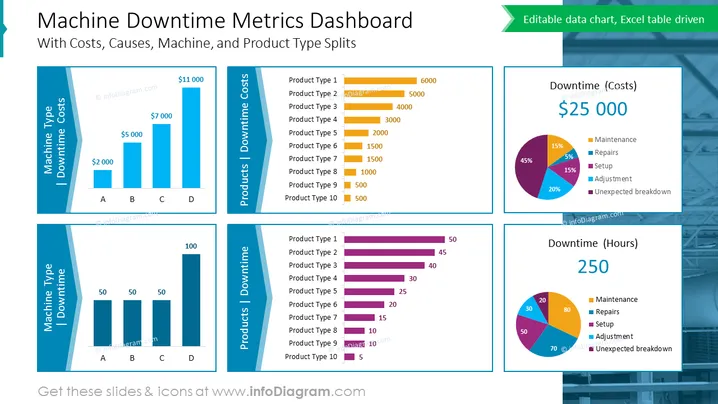
The PowerPoint slide titled "Machine Downtime Metrics Dashboard" provides a detailed analytics interface for visualizing various aspects of industrial downtime. It features cost analysis, breakdowns by machine and product type, and shows causes in both costs and hours. The costs per machine type varying from $2,000 to $11,000 suggest different impacts on the budget, possibly due to varied operations or machine efficiencies. The products downtime costs, ranging from $500 to $6000, indicate how each product type may be contributing to the overall expenditures during downtime. In the cause analysis pie charts, maintenance, repairs, setup, adjustment, and unexpected breakdown are shown in percentages, providing a visual assessment of what factors most significantly contribute to downtime.
The overall appearance of the slide is clean and organized, with color-coding aiding in the distinction between different data types. The visual composition is balanced, with graphical elements strategically placed to facilitate an intuitive understanding of the metrics.



