

Your graphics add a nice touch to my presentations and I recently used them for one of my all-hands meetings. Your toolbox adds professionalism to my slides. Instead of using standard clipart.
Claude Jones, Director of Engineer, @Walmartlabs, USA

Your graphics add a nice touch to my presentations and I recently used them for one of my all-hands meetings. Your toolbox adds professionalism to my slides. Instead of using standard clipart.
Claude Jones, Director of Engineer, @Walmartlabs, USA
I needed a fresh look at some of my slides. I've tried to find a way to create a paintbrush effect, to underline, accentuate, add some color and the handwritten markers were just the things. Very easy to use, easy to size, change the color. It was an affordable, perfect solution and I'm happy to recommend it.
Anonymous, US
The crisp, clean look of the graphics, and the fact that it allowed me to easily edit and change the colors to match the template was my main reason for purchasing them.
Brandie Jenkins, E-learning Developer, USA
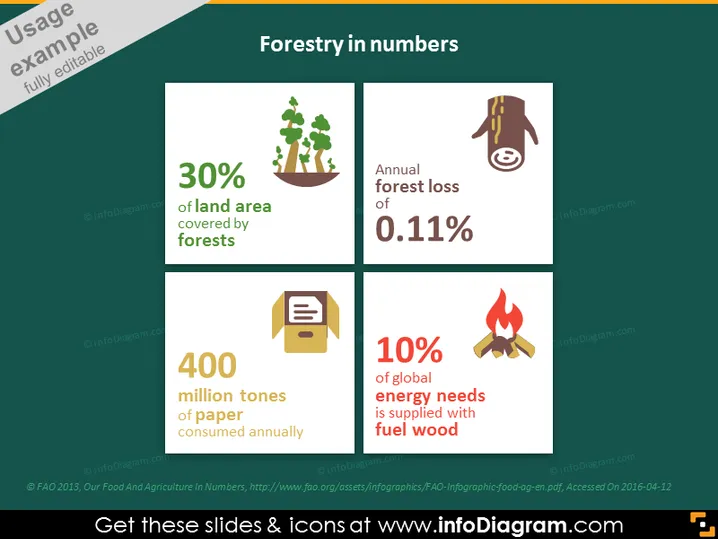
Forestry in numbers is a slide that presents statistical insights into global forestry. The slide contains four key pieces of information: 1) "30% of land area covered by forests," which indicates the percentage of the Earth's land covered by forest; 2) "Annual forest loss of 0.11%," showing the rate at which forests are diminishing each year; 3) "400 million tones of paper consumed annually," suggesting the volume of paper products used globally on an annual basis; 4) "10% of global energy needs is supplied with fuel wood," which reflects the contribution of wood as a source of energy worldwide.
The slide is cleanly designed with a professional color scheme and legible text. The use of icons and contrasting colors effectively conveys key data at a glance.



