

Your graphics add a nice touch to my presentations and I recently used them for one of my all-hands meetings. Your toolbox adds professionalism to my slides. Instead of using standard clipart.
Claude Jones, Director of Engineer, @Walmartlabs, USA

Your graphics add a nice touch to my presentations and I recently used them for one of my all-hands meetings. Your toolbox adds professionalism to my slides. Instead of using standard clipart.
Claude Jones, Director of Engineer, @Walmartlabs, USA
I needed a fresh look at some of my slides. I've tried to find a way to create a paintbrush effect, to underline, accentuate, add some color and the handwritten markers were just the things. Very easy to use, easy to size, change the color. It was an affordable, perfect solution and I'm happy to recommend it.
Anonymous, US
The crisp, clean look of the graphics, and the fact that it allowed me to easily edit and change the colors to match the template was my main reason for purchasing them.
Brandie Jenkins, E-learning Developer, USA
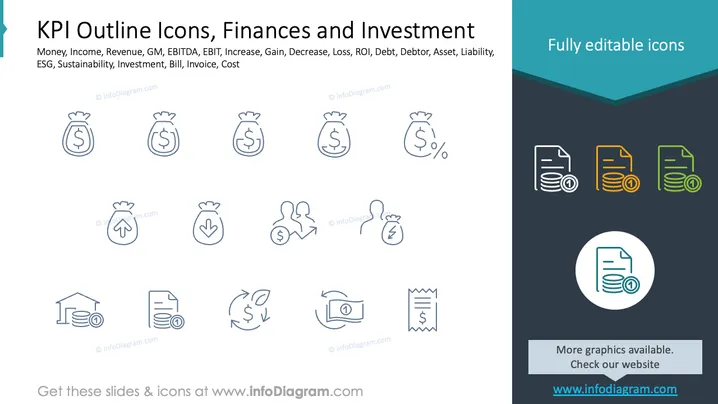
The slide presents a collection of KPI outline icons related to finances and investment. Concepts include money, representing cash flow; income, indicating earnings; revenue, illustrating company earnings from sales; GM (gross margin), showing profitability; EBITDA and EBIT, indicating earnings before interest and taxes; increase and gain, reflecting financial growth; decrease and loss, indicating financial reduction. Other concepts include ROI, related to investment returns; assets and liabilities, indicating company's ownerships and debts; and invoices, detailing billed amounts.
The slide uses a clean, modern style with a focus on clarity through simple iconography and structured layout. Its color scheme and layout emphasize professionalism and organization.



