

Your graphics add a nice touch to my presentations and I recently used them for one of my all-hands meetings. Your toolbox adds professionalism to my slides. Instead of using standard clipart.
Claude Jones, Director of Engineer, @Walmartlabs, USA

Your graphics add a nice touch to my presentations and I recently used them for one of my all-hands meetings. Your toolbox adds professionalism to my slides. Instead of using standard clipart.
Claude Jones, Director of Engineer, @Walmartlabs, USA
I needed a fresh look at some of my slides. I've tried to find a way to create a paintbrush effect, to underline, accentuate, add some color and the handwritten markers were just the things. Very easy to use, easy to size, change the color. It was an affordable, perfect solution and I'm happy to recommend it.
Anonymous, US
The crisp, clean look of the graphics, and the fact that it allowed me to easily edit and change the colors to match the template was my main reason for purchasing them.
Brandie Jenkins, E-learning Developer, USA
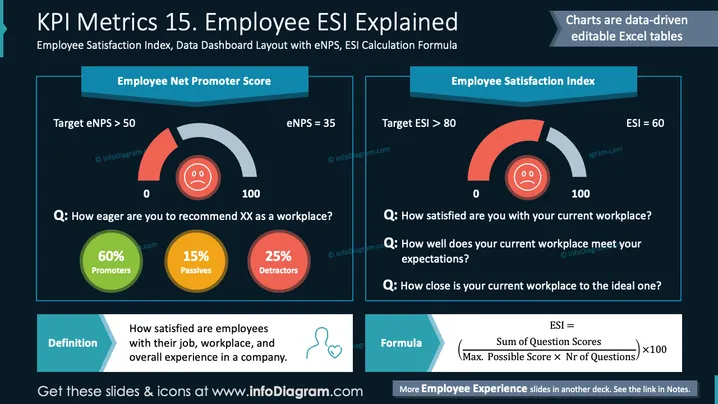
The slide is about assessing employee satisfaction through the Employee Net Promoter Score (eNPS) and the Employee Satisfaction Index (ESI). eNPS is explained using a gauge that measures willingness to recommend the workplace, with scores broken into Promoters (60%), Passives (15%), and Detractors (25%). ESI gauges overall satisfaction, adherence to expectations, and workplace ideals, suggesting that a score above 80 is ideal. The slide also provides the ESI calculation formula.
The slide is visually striking with a professional look, utilizing symmetry and well-chosen colors to emphasize content. Icons and charts aid in simplifying complex metrics.



