

Your graphics add a nice touch to my presentations and I recently used them for one of my all-hands meetings. Your toolbox adds professionalism to my slides. Instead of using standard clipart.
Claude Jones, Director of Engineer, @Walmartlabs, USA

Your graphics add a nice touch to my presentations and I recently used them for one of my all-hands meetings. Your toolbox adds professionalism to my slides. Instead of using standard clipart.
Claude Jones, Director of Engineer, @Walmartlabs, USA
I needed a fresh look at some of my slides. I've tried to find a way to create a paintbrush effect, to underline, accentuate, add some color and the handwritten markers were just the things. Very easy to use, easy to size, change the color. It was an affordable, perfect solution and I'm happy to recommend it.
Anonymous, US
The crisp, clean look of the graphics, and the fact that it allowed me to easily edit and change the colors to match the template was my main reason for purchasing them.
Brandie Jenkins, E-learning Developer, USA
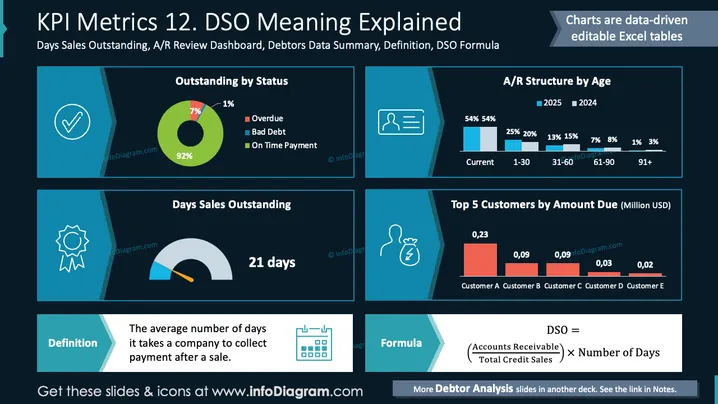
The slide explains "Days Sales Outstanding" (DSO) and its components. "Outstanding by Status" visually displays payment types: overdue (1%), bad debt (7%), and on-time payment (92%). "A/R Structure by Age" shows accounts receivable by age from current to 91+ days. "Days Sales Outstanding" is quantified at 21 days. "Top 5 Customers by Amount Due" lists dues from Customer A to E totaling millions. Definitions and formulas clarify these metrics for financial clarity.
The slide is structured effectively with clear visuals and reliable data representation, enhancing comprehension with neatly arranged charts and icons.



