

Your graphics add a nice touch to my presentations and I recently used them for one of my all-hands meetings. Your toolbox adds professionalism to my slides. Instead of using standard clipart.
Claude Jones, Director of Engineer, @Walmartlabs, USA

Your graphics add a nice touch to my presentations and I recently used them for one of my all-hands meetings. Your toolbox adds professionalism to my slides. Instead of using standard clipart.
Claude Jones, Director of Engineer, @Walmartlabs, USA
I needed a fresh look at some of my slides. I've tried to find a way to create a paintbrush effect, to underline, accentuate, add some color and the handwritten markers were just the things. Very easy to use, easy to size, change the color. It was an affordable, perfect solution and I'm happy to recommend it.
Anonymous, US
The crisp, clean look of the graphics, and the fact that it allowed me to easily edit and change the colors to match the template was my main reason for purchasing them.
Brandie Jenkins, E-learning Developer, USA
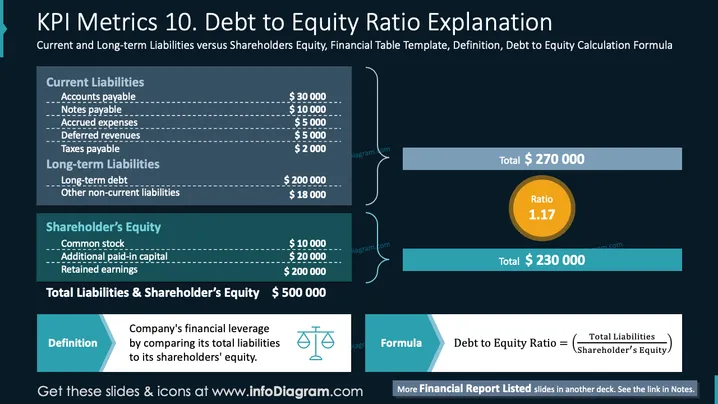
The slide explains the debt to equity ratio, a financial metric that measures a company's financial leverage by comparing its total liabilities to its shareholders' equity. It includes sections for current liabilities such as accounts payable, notes payable, accrued expenses, and taxes payable, and long-term liabilities including long-term debt and other non-current liabilities. Shareholder’s equity is detailed with common stock, additional paid-in capital, and retained earnings. The total liabilities and shareholder's equity are calculated, leading to a debt to equity ratio of 1.17.
The slide is visually structured to clearly break down the financial components and highlight the calculated ratio. The combination of colors and shapes helps segregate information for easy understanding.



