

Your graphics add a nice touch to my presentations and I recently used them for one of my all-hands meetings. Your toolbox adds professionalism to my slides. Instead of using standard clipart.
Claude Jones, Director of Engineer, @Walmartlabs, USA

Your graphics add a nice touch to my presentations and I recently used them for one of my all-hands meetings. Your toolbox adds professionalism to my slides. Instead of using standard clipart.
Claude Jones, Director of Engineer, @Walmartlabs, USA
I needed a fresh look at some of my slides. I've tried to find a way to create a paintbrush effect, to underline, accentuate, add some color and the handwritten markers were just the things. Very easy to use, easy to size, change the color. It was an affordable, perfect solution and I'm happy to recommend it.
Anonymous, US
The crisp, clean look of the graphics, and the fact that it allowed me to easily edit and change the colors to match the template was my main reason for purchasing them.
Brandie Jenkins, E-learning Developer, USA
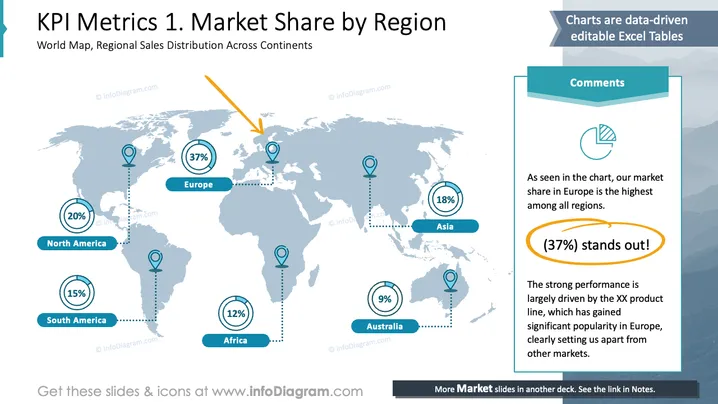
The slide illustrates a global overview of market share distribution across various regions. Europe leads with 37%, highlighting its significant market presence. North America follows with a 20% share, indicating strong performance. Asia holds an 18% share, reflecting substantial engagement. South America and Africa account for 15% and 12% respectively, showing moderate participation. Australia contributes a 9% share, the smallest among the regions.
The slide uses a clear map visual, effectively displaying data with icons and percentages. Design elements focus on significance and clarity, helping to communicate financial insights succinctly.



