

Your graphics add a nice touch to my presentations and I recently used them for one of my all-hands meetings. Your toolbox adds professionalism to my slides. Instead of using standard clipart.
Claude Jones, Director of Engineer, @Walmartlabs, USA

Your graphics add a nice touch to my presentations and I recently used them for one of my all-hands meetings. Your toolbox adds professionalism to my slides. Instead of using standard clipart.
Claude Jones, Director of Engineer, @Walmartlabs, USA
I needed a fresh look at some of my slides. I've tried to find a way to create a paintbrush effect, to underline, accentuate, add some color and the handwritten markers were just the things. Very easy to use, easy to size, change the color. It was an affordable, perfect solution and I'm happy to recommend it.
Anonymous, US
The crisp, clean look of the graphics, and the fact that it allowed me to easily edit and change the colors to match the template was my main reason for purchasing them.
Brandie Jenkins, E-learning Developer, USA
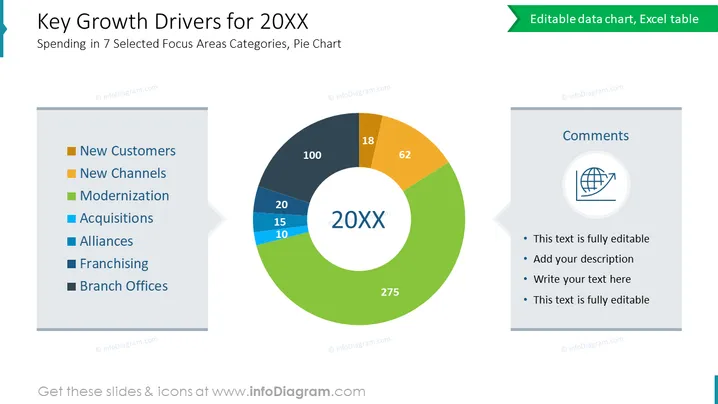
The slide is primarily designed to present the key growth drivers for a certain year (20XX), focusing on spending in seven distinct areas as indicated by a pie chart. Each sector mentioned is a potential area that may contribute to overall growth: 'New Customers' likely refers to expanding the customer base, 'New Channels' suggests introducing new platforms for sales or communication, 'Modernization' indicates investing in up-to-date technology or processes, 'Acquisitions' points to growing through purchasing other companies, 'Alliances' implies partnerships that can enhance capabilities, 'Franchising' involves expanding brand presence, and 'Branch Offices' could mean opening new locations for accessibility or market penetration.
The slide is clean and professionally designed with a modern aesthetic. The dominating element is the colorful pie chart, which effectively captures the viewer's attention, while the comments section offers space for annotations or additional insights.



