

Your graphics add a nice touch to my presentations and I recently used them for one of my all-hands meetings. Your toolbox adds professionalism to my slides. Instead of using standard clipart.
Claude Jones, Director of Engineer, @Walmartlabs, USA

Your graphics add a nice touch to my presentations and I recently used them for one of my all-hands meetings. Your toolbox adds professionalism to my slides. Instead of using standard clipart.
Claude Jones, Director of Engineer, @Walmartlabs, USA
I needed a fresh look at some of my slides. I've tried to find a way to create a paintbrush effect, to underline, accentuate, add some color and the handwritten markers were just the things. Very easy to use, easy to size, change the color. It was an affordable, perfect solution and I'm happy to recommend it.
Anonymous, US
The crisp, clean look of the graphics, and the fact that it allowed me to easily edit and change the colors to match the template was my main reason for purchasing them.
Brandie Jenkins, E-learning Developer, USA
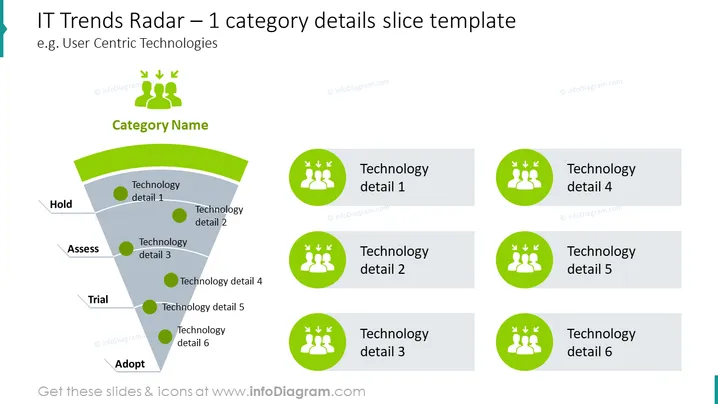
The slide serves as a template for plotting the adoption stages of IT trends within a single category, exemplified as "User Centric Technologies." It has a segmented radar with stages labeled "Hold," "Assess," "Trial," and "Adopt," where different technological details (detail 1 to detail 6) are placed according to their current status in the adoption process. This visual categorization helps in strategic planning and prioritizing IT initiatives based on their readiness for implementation.
The graphical layout is simple and clean, with a color scheme that highlights the category and stages of adoption using green and grey tones. The icons are uniform in design, providing a clear visual reference for each technology detail.
Such a slide is well-suited for business presentations that aim to discuss the adoption and integration of new technologies, particularly in IT strategy meetings, digital transformation workshops, and project prioritization sessions.



