
Your graphics add a nice touch to my presentations and I recently used them for one of my all-hands meetings. Your toolbox adds professionalism to my slides. Instead of using standard clipart.
Claude Jones, Director of Engineer, @Walmartlabs, USA

Your graphics add a nice touch to my presentations and I recently used them for one of my all-hands meetings. Your toolbox adds professionalism to my slides. Instead of using standard clipart.
Claude Jones, Director of Engineer, @Walmartlabs, USA

I needed a fresh look at some of my slides. I've tried to find a way to create a paintbrush effect, to underline, accentuate, add some color and the handwritten markers were just the things. Very easy to use, easy to size, change the color. It was an affordable, perfect solution and I'm happy to recommend it.
Anonymous, US
The crisp, clean look of the graphics, and the fact that it allowed me to easily edit and change the colors to match the template was my main reason for purchasing them.
Brandie Jenkins, E-learning Developer, USA
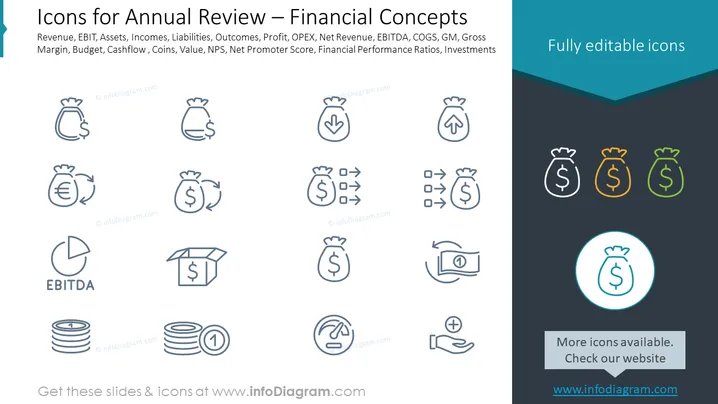
The slide is titled "Icons for Annual Review – Financial Concepts" and presents a collection of graphical icons representing various financial terms and metrics used in business. These include Revenue, EBIT (Earnings Before Interest and Taxes), Assets, Incomes, Liabilities, Outcomes, Profit, OPEX (Operational Expenditures), Net Revenue, EBITDA (Earnings Before Interest, Taxes, Depreciation, and Amortization), COGS (Cost of Goods Sold), GM (Gross Margin), Gross Margin, Budget, Cashflow, Coins, Value, NPS (Net Promoter Score), Financial Performance Ratios, and Investments. Each term is associated with an icon that visualizes the concept it represents.
The overall look of the slide is clean and professional, with a color scheme that is consistent and conducive to a corporate or financial presentation. The icons are designed to be clear and easily identifiable, representing their corresponding financial concepts with minimalistic imagery.
To elaborate on the Use Cases:
During an annual corporate meeting to present key financial metrics and performance indicators to stakeholders.
In financial training materials to help familiarize new employees with common financial terms and their representations.
As part of a presentation to potential investors to visually summarize the financial health and processes of a company.
Within a business strategy session, enabling quick reference to various financial aspects that are under discussion.


