

Your graphics add a nice touch to my presentations and I recently used them for one of my all-hands meetings. Your toolbox adds professionalism to my slides. Instead of using standard clipart.
Claude Jones, Director of Engineer, @Walmartlabs, USA

Your graphics add a nice touch to my presentations and I recently used them for one of my all-hands meetings. Your toolbox adds professionalism to my slides. Instead of using standard clipart.
Claude Jones, Director of Engineer, @Walmartlabs, USA
I needed a fresh look at some of my slides. I've tried to find a way to create a paintbrush effect, to underline, accentuate, add some color and the handwritten markers were just the things. Very easy to use, easy to size, change the color. It was an affordable, perfect solution and I'm happy to recommend it.
Anonymous, US
The crisp, clean look of the graphics, and the fact that it allowed me to easily edit and change the colors to match the template was my main reason for purchasing them.
Brandie Jenkins, E-learning Developer, USA
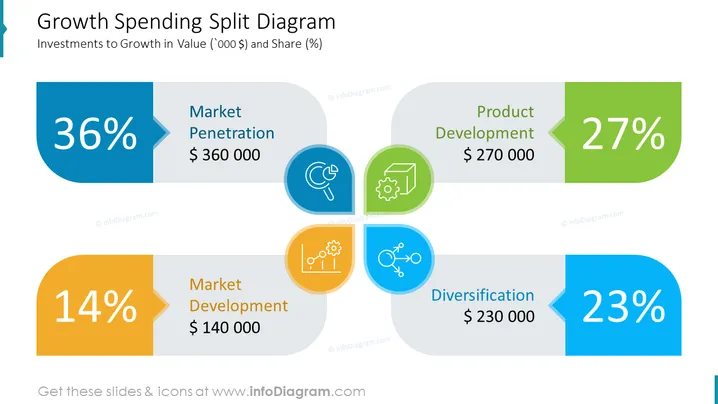
The slide titled "Growth Spending Split Diagram" details the investments to growth in value using monetary figures and percentages. It breaks down the spending into three categories: Market Penetration (36% and $360,000), denoting expanding the market share of existing products; Product Development (27% and $270,000), indicating the creation or improvement of products; and Diversification (23% and $230,000), involving expanding into new markets or product lines. Additionally, a smaller section highlights Market Development (14% and $140,000), which entails entering new markets with current products.
The slide has a modern and clean visual appeal, using a combination of graphics and text to represent financial data in a clear and understandable way. The design elements are arranged in a balanced manner, making excellent use of whitespace to avoid clutter.



