

Your graphics add a nice touch to my presentations and I recently used them for one of my all-hands meetings. Your toolbox adds professionalism to my slides. Instead of using standard clipart.
Claude Jones, Director of Engineer, @Walmartlabs, USA

Your graphics add a nice touch to my presentations and I recently used them for one of my all-hands meetings. Your toolbox adds professionalism to my slides. Instead of using standard clipart.
Claude Jones, Director of Engineer, @Walmartlabs, USA
I needed a fresh look at some of my slides. I've tried to find a way to create a paintbrush effect, to underline, accentuate, add some color and the handwritten markers were just the things. Very easy to use, easy to size, change the color. It was an affordable, perfect solution and I'm happy to recommend it.
Anonymous, US
The crisp, clean look of the graphics, and the fact that it allowed me to easily edit and change the colors to match the template was my main reason for purchasing them.
Brandie Jenkins, E-learning Developer, USA
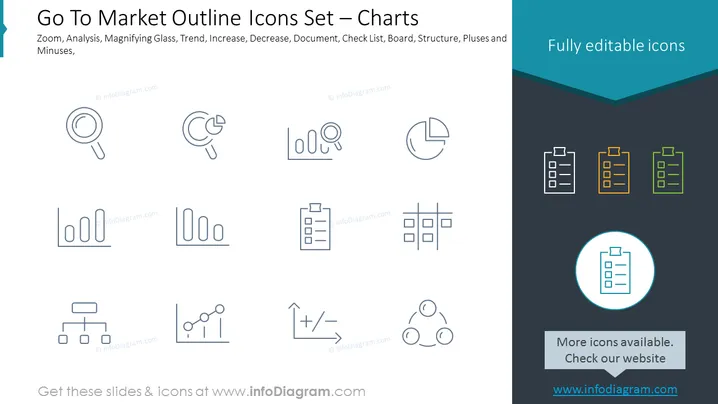
The slide presents a collection of outline icons that are related to go-to-market strategies and data analysis visuals. These icons include representations for concepts such as Zoom, Analysis, Magnifying Glass, Trend, Increase, Decrease, Document, Check List, Board, Structure, Pluses, and Minuses. Each icon is designed to visually summarize a specific concept or tool used in market analysis and strategic planning. For example, the Magnifying Glass icon suggests detailed inspection or analysis, while the Trend icon depicts the idea of tracking changes or developments over time.
The slide's overall look is modern and professional, with a balance of simple iconography and strategic placement that creates a clear visual hierarchy. The use of a dark blue banner adds a subtle touch of color to the otherwise monochrome design.



