
Your graphics add a nice touch to my presentations and I recently used them for one of my all-hands meetings. Your toolbox adds professionalism to my slides. Instead of using standard clipart.
Claude Jones, Director of Engineer, @Walmartlabs, USA

Your graphics add a nice touch to my presentations and I recently used them for one of my all-hands meetings. Your toolbox adds professionalism to my slides. Instead of using standard clipart.
Claude Jones, Director of Engineer, @Walmartlabs, USA

I needed a fresh look at some of my slides. I've tried to find a way to create a paintbrush effect, to underline, accentuate, add some color and the handwritten markers were just the things. Very easy to use, easy to size, change the color. It was an affordable, perfect solution and I'm happy to recommend it.
Anonymous, US
The crisp, clean look of the graphics, and the fact that it allowed me to easily edit and change the colors to match the template was my main reason for purchasing them.
Brandie Jenkins, E-learning Developer, USA
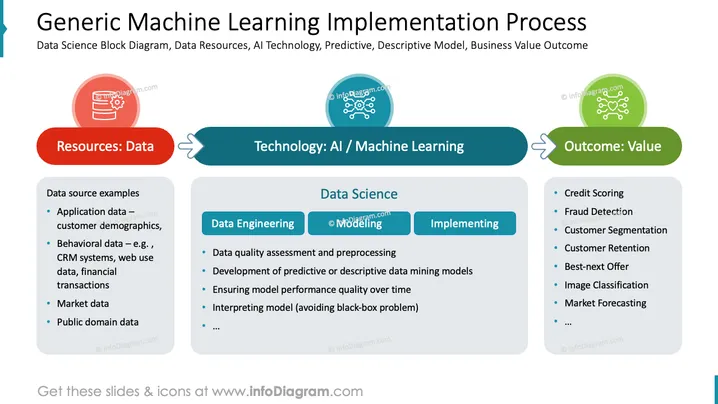
The slide appears to describe a high-level overview of a machine learning project from start to finish. "Resources: Data" signifies the initial stage, emphasizing the importance of data acquisition detailing application data, behavioral data from CRM systems, market data, and public domain data. "Technology: AI / Machine Learning" represents the core methodology applied, involving data engineering like data quality assessment, and modeling, which includes the development of predictive models and ensuring their performance over time. Finally, "Outcome: Value" outlines potential results such as credit scoring, fraud detection, customer segmentation, and market forecasting, demonstrating the tangible value generated by implementing these technologies.
The slide has a clean and professional appearance, with a logical flow that is easy to follow. The use of icons and color coding effectively differentiates the different stages of the machine learning implementation process.


