

Your graphics add a nice touch to my presentations and I recently used them for one of my all-hands meetings. Your toolbox adds professionalism to my slides. Instead of using standard clipart.
Claude Jones, Director of Engineer, @Walmartlabs, USA

Your graphics add a nice touch to my presentations and I recently used them for one of my all-hands meetings. Your toolbox adds professionalism to my slides. Instead of using standard clipart.
Claude Jones, Director of Engineer, @Walmartlabs, USA
I needed a fresh look at some of my slides. I've tried to find a way to create a paintbrush effect, to underline, accentuate, add some color and the handwritten markers were just the things. Very easy to use, easy to size, change the color. It was an affordable, perfect solution and I'm happy to recommend it.
Anonymous, US
The crisp, clean look of the graphics, and the fact that it allowed me to easily edit and change the colors to match the template was my main reason for purchasing them.
Brandie Jenkins, E-learning Developer, USA
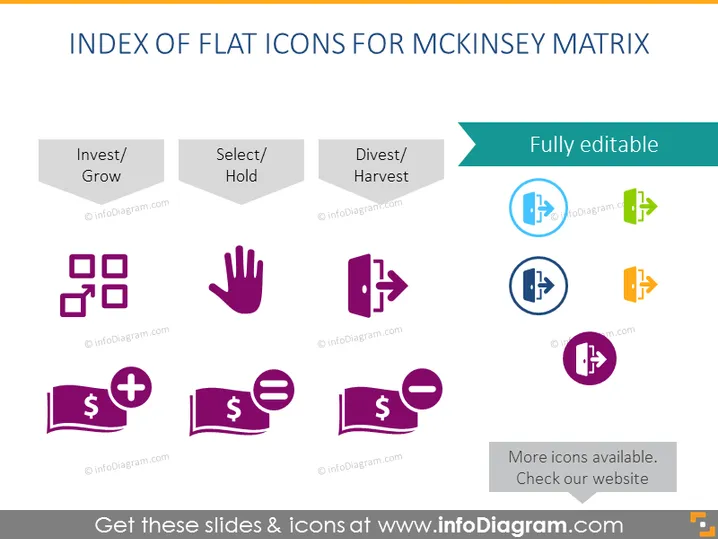
The PowerPoint slide is titled "INDEX OF FLAT ICONS FOR MCKINSEY MATRIX" which indicates a collection of icons that correlate with the McKinsey Matrix framework for business analysis. The slide shows three categories of strategic actions: "Invest/Grow," "Select/Hold," and "Divest/Harvest." Under "Invest/Grow," icons represent growth or expansion, like clusters of squares suggesting organization or growth. "Select/Hold" features a hand icon, denoting selection or pause, while "Divest/Harvest" depicts a door half-open, connoting release or cutting off. Another set of grouped icons below represents financial actions with currency symbols, addition signs, and equal signs, emphasizing monetary decisions linked to the strategic directions.
The slide uses geometric shapes (rectangles, squares, arrows) and simple flat icons to visually segment and emphasize key concepts. The consistent use of monochromatic icon sets for each category creates a visually harmonious and organized appearance.



