Flat Arrows for Modeling Supply Chain Process
Slide Content
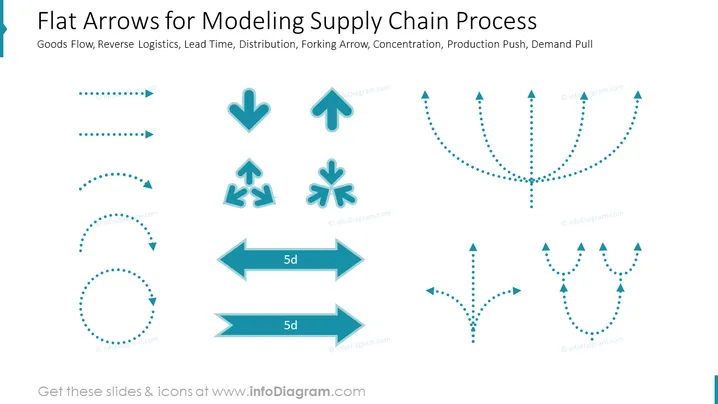
The slide is focused on the visualization of various supply chain processes using flat arrows. It lists key concepts below the title: Goods Flow, Reverse Logistics, Lead Time, Distribution, Forking Arrow, Concentration, Production Push, and Demand Pull. Each of these represents a critical aspect of supply chain management: Goods Flow indicates the movement of products, Reverse Logistics covers the return of goods from customers, Lead Time is the time from initiation to completion of a process, Distribution involves delivering products to the required destination, Forking Arrow denotes the split of resources into multiple paths, Concentration signifies the gathering of resources, Production Push is about production driven by forecast, and Demand Pull refers to production driven by customer demand.
Graphical Look
- The slide has a clean and modern design with a white background.
- The top of the slide features the title in a large, bold, blue font.
- Below the title, there's a subtitle in a smaller font, listing the supply chain concepts.
- The slide is divided into three columns, with various arrow graphics in each.
- The first column displays dashed arrow lines in different shapes: straight, curved, and looped.
- The second column presents arrows combined with multiple arrowheads, pointing in different directions, and a couple of them include text placeholders with '5d'.
- The third column consists of dotted line arrows branching out and converging in different ways.
- All arrows are shades of blue, ranging from dark to light.
The slide has a harmonious and professional look, with a consistent color theme and graphical style that is visually appealing while conveying the structure and movement of supply chain processes.
Use Cases
- To illustrate key supply chain concepts in a business strategy presentation.
- To explain the logistics and flow of goods within a company to new employees during an orientation training.
- To map out and present different stages of a product's lifecycle in a meeting with stakeholders.
-
Flat Arrows for Modeling Supply Chain Process
Slide Content
The slide, titled "Flat Arrows for Modeling Supply Chain Process", focuses on visual symbols representing different supply chain mechanisms such as Goods Flow, handling product movement; Reverse Logistics, dealing with the return process; Lead Time, the duration between initiating and completing a task; Distribution, the dispersal of goods to destinations; Forking Arrow, indicating resource paths division; Concentration, the consolidation of resources; Production Push, inventory-driven production; and Demand Pull, customer-driven production strategy. The inclusion of the term "5d" suggests a specific time frame, likely a period of five days.
Graphical Look
- Title in a dark blue, bold typeface at the top of the slide
- Subtitle in a smaller font, listing key supply chain concepts
- Three columns of distinct arrow graphics, each column illustrating different conceptual arrows
- Left column features dashed arrows pointing in various directions including straight, curved, and circular patterns
- Center column shows solid arrows with multiple points and two arrows labeled with "5d" indicating a time span
- Right column contains dotted-line arrows depicting branching and converging patterns
- Color palette consists of varying shades of blue for the arrows
- No background image or pattern, using a clean white backdrop
The slide has a straightforward and uncluttered appearance with a cohesive blue color scheme that emphasizes the flow and directionality inherent to supply chain processes. The use of arrows as visual metaphors is effective in conveying movement and connections within the supply chain structure.
Use Cases
- To present an overview of supply chain management concepts during an executive briefing or strategy meeting
- For educational purposes, such as teaching supply chain and logistics students about process flows
- In workshops and seminars aimed at improving supply chain efficiency and introducing new methods
- As a visual aid during a sales pitch to explain how a company manages its supply chain, highlighting efficiency and optimization