

Your graphics add a nice touch to my presentations and I recently used them for one of my all-hands meetings. Your toolbox adds professionalism to my slides. Instead of using standard clipart.
Claude Jones, Director of Engineer, @Walmartlabs, USA

Your graphics add a nice touch to my presentations and I recently used them for one of my all-hands meetings. Your toolbox adds professionalism to my slides. Instead of using standard clipart.
Claude Jones, Director of Engineer, @Walmartlabs, USA
I needed a fresh look at some of my slides. I've tried to find a way to create a paintbrush effect, to underline, accentuate, add some color and the handwritten markers were just the things. Very easy to use, easy to size, change the color. It was an affordable, perfect solution and I'm happy to recommend it.
Anonymous, US
The crisp, clean look of the graphics, and the fact that it allowed me to easily edit and change the colors to match the template was my main reason for purchasing them.
Brandie Jenkins, E-learning Developer, USA
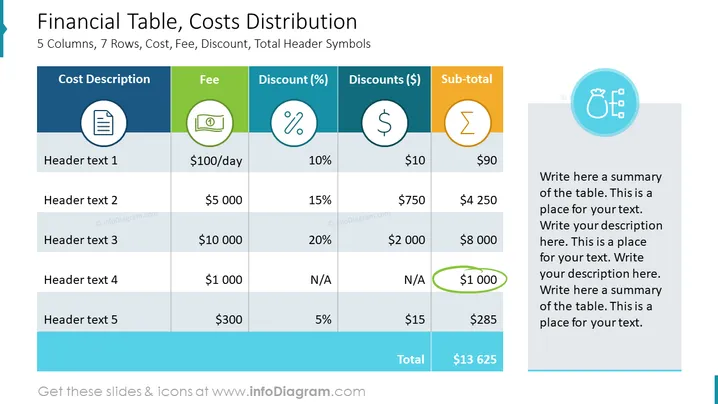
The slide shows a financial table that outlines cost distribution across five columns, labeled with cost descriptions, fees, discounts in percentages and dollars, and a sub-total for each item. There are five rows for different cost items, each detailed with header texts (1-5), with an additional row at the bottom displaying the total. For instance, "Header text 1" indicates a daily fee of $100 with a 10% discount, leading to a sub-total of $90, and "Header text 4" reflects a fee of $1,000 with no applicable discounts, totaling the same amount. The table is designed to present a clear summary of fees and discounts applied to various costs, culminating in a grand total.
The slide uses a mix of colors, icons, and alternating row shadings to create an easy-to-follow financial overview. Textual information is supported by visual cues that make the content more engaging and accessible.



