

Your graphics add a nice touch to my presentations and I recently used them for one of my all-hands meetings. Your toolbox adds professionalism to my slides. Instead of using standard clipart.
Claude Jones, Director of Engineer, @Walmartlabs, USA

Your graphics add a nice touch to my presentations and I recently used them for one of my all-hands meetings. Your toolbox adds professionalism to my slides. Instead of using standard clipart.
Claude Jones, Director of Engineer, @Walmartlabs, USA
I needed a fresh look at some of my slides. I've tried to find a way to create a paintbrush effect, to underline, accentuate, add some color and the handwritten markers were just the things. Very easy to use, easy to size, change the color. It was an affordable, perfect solution and I'm happy to recommend it.
Anonymous, US
The crisp, clean look of the graphics, and the fact that it allowed me to easily edit and change the colors to match the template was my main reason for purchasing them.
Brandie Jenkins, E-learning Developer, USA
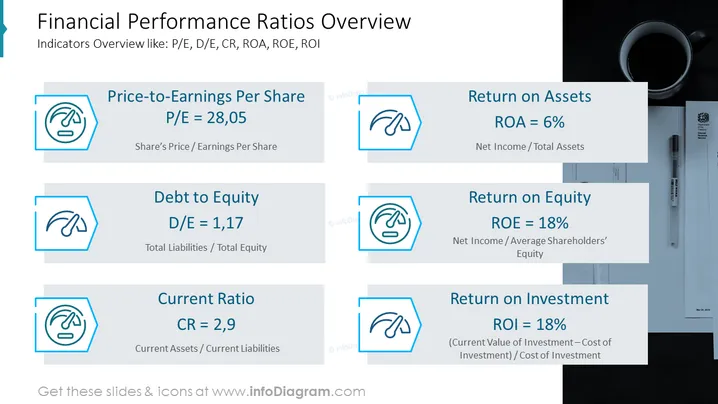
The slide provides a snapshot of various key financial ratios for a company. These ratios include the Price-to-Earnings Per Share (P/E), which is presented as 28.05, indicating the ratio of the company's share price to its earnings per share. Debt to Equity (D/E) is given as 1.17, showing the company's financial leverage by comparing its total liabilities to total equity. The Current Ratio (CR) is 2.9, which assesses the company's ability to pay short-term obligations. Return on Assets (ROA) at 6% measures how efficiently the company's assets generate profit. Return on Equity (ROE) is 18%, showing the profitability generated from shareholders' equity. Lastly, the Return on Investment (ROI) also stands at 18%, representing the percentage of invested money returned to the investor.
The financial ratios mentioned on a slide:
Price-to-Earnings Per Share (P/E Ratio): This ratio measures a company’s current share price relative to its per-share earnings. A high P/E ratio could mean that a company’s stock is over-valued, or investors are expecting high growth rates in the future.
Debt to Equity (D/E Ratio): This measures a company's financial leverage and shows the proportion of equity and debt a company is using to finance its assets. A higher D/E ratio could indicate that a company is more risky to invest in, as it relies more heavily on debt.
Current Ratio (CR): This liquidity ratio measures a company's ability to pay off its short-term liabilities with its short-term assets. A ratio above 1 indicates that the company has more assets than liabilities, suggesting better financial health.
Return on Assets (ROA): This profitability ratio illustrates how effectively a company is using its assets to generate earnings. The higher the ROA, the more efficiently a company's management is using its assets to generate income.
Return on Equity (ROE): This measures the profitability of a company by revealing how much profit a company generates with the money shareholders have invested. A higher ROE indicates that the company is more effective in generating income on new investments.
Return on Investment (ROI): This performance measure is used to evaluate the efficiency of an investment or to compare the efficiencies of several different investments. ROI tries to directly measure the amount of return on a particular investment, relative to the investment’s cost.
The overall look of the slide is professional and clean, with a structured layout that clearly categorizes and presents each financial ratio. The use of icons and color highlights helps to differentiate between the various data points, making the slide visually engaging.
This slide is ideal for business presentations aimed at investors, financial analysts, or company stakeholders who need a concise overview of a company's financial health. It could be used in annual general meetings, investor relations presentations, or internal strategic reviews to communicate the company's financial performance and investment potential.



