
Your graphics add a nice touch to my presentations and I recently used them for one of my all-hands meetings. Your toolbox adds professionalism to my slides. Instead of using standard clipart.
Claude Jones, Director of Engineer, @Walmartlabs, USA

Your graphics add a nice touch to my presentations and I recently used them for one of my all-hands meetings. Your toolbox adds professionalism to my slides. Instead of using standard clipart.
Claude Jones, Director of Engineer, @Walmartlabs, USA

I needed a fresh look at some of my slides. I've tried to find a way to create a paintbrush effect, to underline, accentuate, add some color and the handwritten markers were just the things. Very easy to use, easy to size, change the color. It was an affordable, perfect solution and I'm happy to recommend it.
Anonymous, US
The crisp, clean look of the graphics, and the fact that it allowed me to easily edit and change the colors to match the template was my main reason for purchasing them.
Brandie Jenkins, E-learning Developer, USA
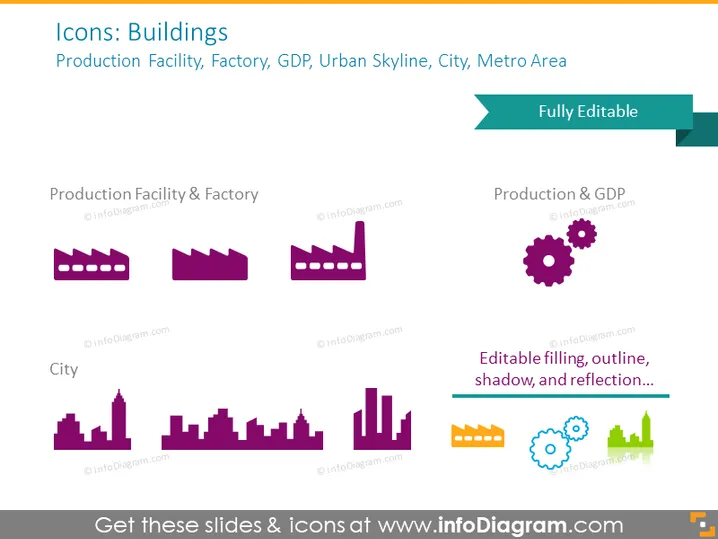
The PowerPoint slide titled "Icons: Buildings" showcases a collection of icons related to urban development and economic indicators such as production facilities, factories, GDP, urban skylines, cities, and metro areas. The first set labeled "Production Facility & Factory" includes icons representing industrial buildings. The "City" section contains icons depicting different silhouettes of urban skylines, emphasizing variability in the city landscape. The phrase "Fully Editable" suggests that these icons can be customized to fit different presentation needs, while "Production & GDP" likely implies that some icons combine industrial and economic themes.
The slide exudes a professional and minimalist design, focused on visual representation of different building and economic concepts. The use of color is limited to purples and teals, providing a unified and modern aesthetic.


