
Your graphics add a nice touch to my presentations and I recently used them for one of my all-hands meetings. Your toolbox adds professionalism to my slides. Instead of using standard clipart.
Claude Jones, Director of Engineer, @Walmartlabs, USA

Your graphics add a nice touch to my presentations and I recently used them for one of my all-hands meetings. Your toolbox adds professionalism to my slides. Instead of using standard clipart.
Claude Jones, Director of Engineer, @Walmartlabs, USA

I needed a fresh look at some of my slides. I've tried to find a way to create a paintbrush effect, to underline, accentuate, add some color and the handwritten markers were just the things. Very easy to use, easy to size, change the color. It was an affordable, perfect solution and I'm happy to recommend it.
Anonymous, US
The crisp, clean look of the graphics, and the fact that it allowed me to easily edit and change the colors to match the template was my main reason for purchasing them.
Brandie Jenkins, E-learning Developer, USA
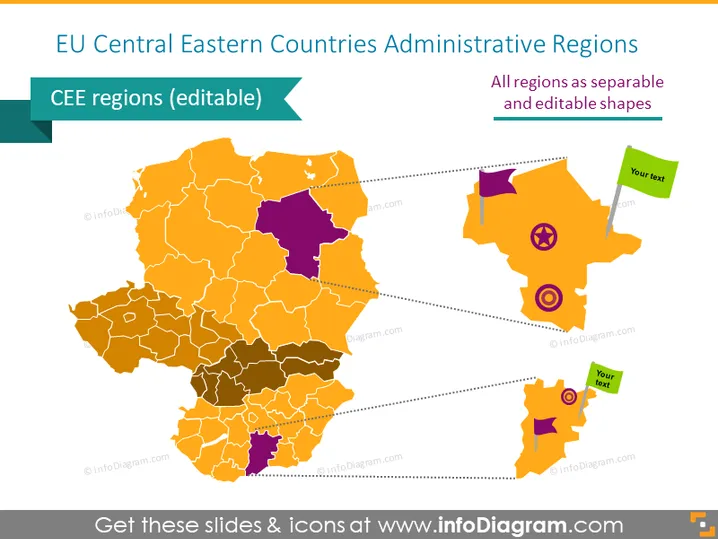
This PowerPoint slide presents a map highlighting the administrative regions of Central Eastern European (CEE) countries within the EU. It indicates that the regions on the map are editable, meaning that they can be individually manipulated in the presentation to show specific details or data. The map depicts varying regions using different shades of orange, while one region is highlighted in purple. Dotted lines connect some of the regions to text boxes, enabling the presenter to add contextual information adjacent to these regions.
The slide has a clean, professional look with a focus on the editable regions. The use of color contrast and icons emphasizes interactivity and the potential for customization.


