

Your graphics add a nice touch to my presentations and I recently used them for one of my all-hands meetings. Your toolbox adds professionalism to my slides. Instead of using standard clipart.
Claude Jones, Director of Engineer, @Walmartlabs, USA

Your graphics add a nice touch to my presentations and I recently used them for one of my all-hands meetings. Your toolbox adds professionalism to my slides. Instead of using standard clipart.
Claude Jones, Director of Engineer, @Walmartlabs, USA
I needed a fresh look at some of my slides. I've tried to find a way to create a paintbrush effect, to underline, accentuate, add some color and the handwritten markers were just the things. Very easy to use, easy to size, change the color. It was an affordable, perfect solution and I'm happy to recommend it.
Anonymous, US
The crisp, clean look of the graphics, and the fact that it allowed me to easily edit and change the colors to match the template was my main reason for purchasing them.
Brandie Jenkins, E-learning Developer, USA
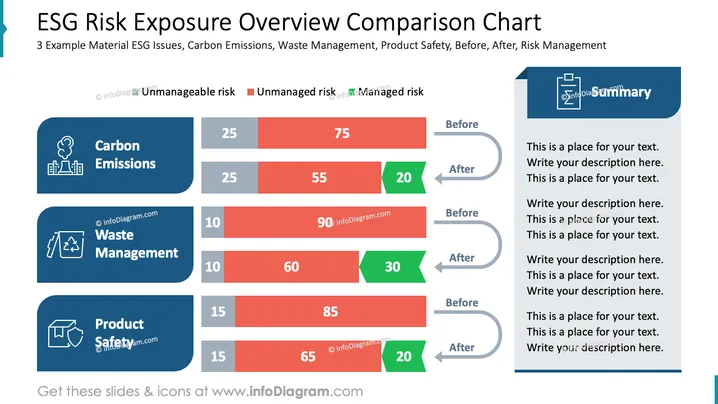
The slide presents a comparison of ESG risk exposures before and after risk management interventions in three areas: Carbon Emissions, Waste Management, and Product Safety. Each area includes a breakdown of risks into three categories: Unmanageable, Unmanaged, and Managed risks. Carbon Emissions shows a shift from 75% unmanaged risk to 20% managed. Waste Management reduces unmanaged risk from 90% to 30%. Product Safety decreases unmanaged risk from 85% to 20%, highlighting effective risk control measures.
The slide maintains a professional and concise layout, using colors strategically to emphasize changes in risk management outcomes. It balances text and graphics effectively.



