

Your graphics add a nice touch to my presentations and I recently used them for one of my all-hands meetings. Your toolbox adds professionalism to my slides. Instead of using standard clipart.
Claude Jones, Director of Engineer, @Walmartlabs, USA

Your graphics add a nice touch to my presentations and I recently used them for one of my all-hands meetings. Your toolbox adds professionalism to my slides. Instead of using standard clipart.
Claude Jones, Director of Engineer, @Walmartlabs, USA
I needed a fresh look at some of my slides. I've tried to find a way to create a paintbrush effect, to underline, accentuate, add some color and the handwritten markers were just the things. Very easy to use, easy to size, change the color. It was an affordable, perfect solution and I'm happy to recommend it.
Anonymous, US
The crisp, clean look of the graphics, and the fact that it allowed me to easily edit and change the colors to match the template was my main reason for purchasing them.
Brandie Jenkins, E-learning Developer, USA
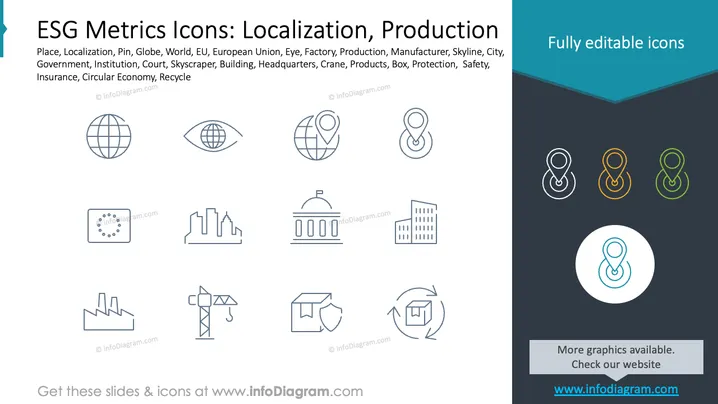
This slide presents various icons related to ESG (Environmental, Social, and Governance) metrics focused on localization and production. Key concepts illustrated include: Place and Localization (depicting location-specific identifiers), Globe and World (global presence and connectivity), EU (European Union membership), Eye (oversight or monitoring), Factory and Manufacturer (industrial production processes), Skyline and City (urban development and infrastructure), Crane (construction), Products and Box (goods and supply chain), Protection and Safety (security measures), Circular Economy and Recycle (sustainability and resource reuse).
The overall look is clean and professional, focusing on icon clarity and utility for representing various ESG metrics visually. The design effectively communicates the technical concepts.



