

Your graphics add a nice touch to my presentations and I recently used them for one of my all-hands meetings. Your toolbox adds professionalism to my slides. Instead of using standard clipart.
Claude Jones, Director of Engineer, @Walmartlabs, USA

Your graphics add a nice touch to my presentations and I recently used them for one of my all-hands meetings. Your toolbox adds professionalism to my slides. Instead of using standard clipart.
Claude Jones, Director of Engineer, @Walmartlabs, USA
I needed a fresh look at some of my slides. I've tried to find a way to create a paintbrush effect, to underline, accentuate, add some color and the handwritten markers were just the things. Very easy to use, easy to size, change the color. It was an affordable, perfect solution and I'm happy to recommend it.
Anonymous, US
The crisp, clean look of the graphics, and the fact that it allowed me to easily edit and change the colors to match the template was my main reason for purchasing them.
Brandie Jenkins, E-learning Developer, USA
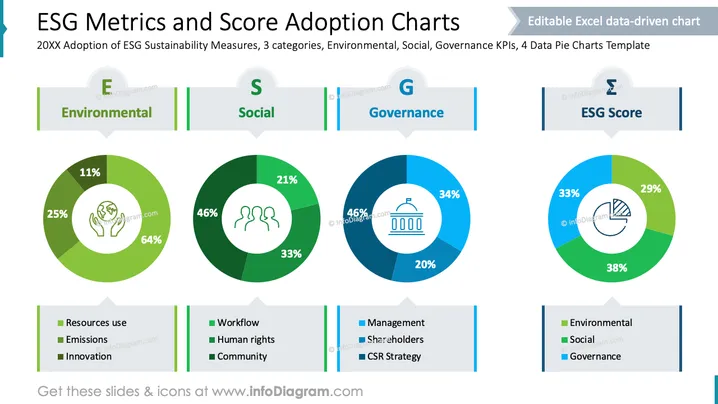
The slide presents ESG (Environmental, Social, Governance) metrics using pie charts to illustrate the adoption of sustainability measures in three categories. The Environmental section outlines aspects like resource use, emissions, and innovation with respective contributions. The Social section discusses workflow, human rights, and community impacts. Governance covers management, shareholder relations, and corporate social responsibility strategies. An overall ESG Score is generated based on these categories.
The slide's visuals are clean, effectively using color coding and icons to differentiate each ESG area. This easy-to-follow design supports clear data comprehension, enhancing understanding of ESG metrics.



