
Your graphics add a nice touch to my presentations and I recently used them for one of my all-hands meetings. Your toolbox adds professionalism to my slides. Instead of using standard clipart.
Claude Jones, Director of Engineer, @Walmartlabs, USA
Your graphics add a nice touch to my presentations and I recently used them for one of my all-hands meetings. Your toolbox adds professionalism to my slides. Instead of using standard clipart.
Claude Jones, Director of Engineer, @Walmartlabs, USA
I needed a fresh look at some of my slides. I've tried to find a way to create a paintbrush effect, to underline, accentuate, add some color and the handwritten markers were just the things. Very easy to use, easy to size, change the color. It was an affordable, perfect solution and I'm happy to recommend it.
Anonymous, US
The crisp, clean look of the graphics, and the fact that it allowed me to easily edit and change the colors to match the template was my main reason for purchasing them.
Brandie Jenkins, E-learning Developer, USA
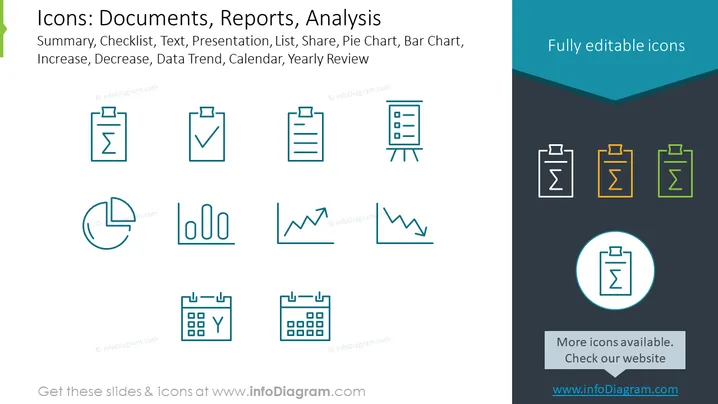
The slide presents a collection of icons associated with documents, reports, and analysis, suitable for business and academic presentations. "Summary" is likely indicative of a condensed version of information, "Checklist" implies items to be reviewed or actions to be taken, "Text" could represent written content or document focus, "Presentation" hints at showcasing information, "List" may suggest itemization, "Share" conveys distribution or collaboration, "Pie Chart" and "Bar Chart" indicate data visualizations, "Increase" and "Decrease" show upward or downward trends, "Data Trend" signifies analyzing data over time, and "Calendar" and "Yearly Review" suggest scheduling or annual summarization.
The slide has a clean and modern design with a cool color scheme that effectively highlights the icons. The overall layout is balanced and easy to navigate visually.




