
Your graphics add a nice touch to my presentations and I recently used them for one of my all-hands meetings. Your toolbox adds professionalism to my slides. Instead of using standard clipart.
Claude Jones, Director of Engineer, @Walmartlabs, USA
Your graphics add a nice touch to my presentations and I recently used them for one of my all-hands meetings. Your toolbox adds professionalism to my slides. Instead of using standard clipart.
Claude Jones, Director of Engineer, @Walmartlabs, USA
I needed a fresh look at some of my slides. I've tried to find a way to create a paintbrush effect, to underline, accentuate, add some color and the handwritten markers were just the things. Very easy to use, easy to size, change the color. It was an affordable, perfect solution and I'm happy to recommend it.
Anonymous, US
The crisp, clean look of the graphics, and the fact that it allowed me to easily edit and change the colors to match the template was my main reason for purchasing them.
Brandie Jenkins, E-learning Developer, USA
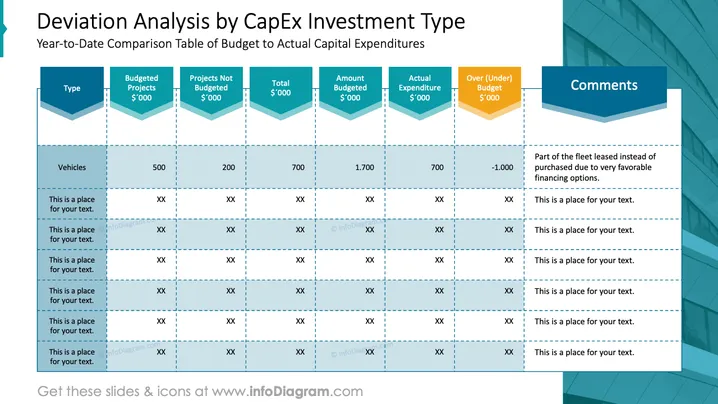
The slide is a financial chart titled "Deviation Analysis by CapEx Investment Type," presenting a Year-to-Date Comparison Table of Budget to Actual Capital Expenditures. The chart is organized with headings: 'Type,' 'Budgeted Projects,' 'Projects Not Budgeted,' 'Total,' 'Amount Budgeted,' 'Actual Expenditure,' 'Over (Under) Budget,' and 'Comments.' An example row is filled for 'Vehicles,' showing various financial figures in thousands and a note explaining a leasing decision due to favorable financing. Remaining rows contain placeholders for text.
The slide uses a professional and clean design, with a color scheme that is consistent throughout. The use of graphics is minimal, focusing on clarity and easy read of the data presented.




