
Your graphics add a nice touch to my presentations and I recently used them for one of my all-hands meetings. Your toolbox adds professionalism to my slides. Instead of using standard clipart.
Claude Jones, Director of Engineer, @Walmartlabs, USA
Your graphics add a nice touch to my presentations and I recently used them for one of my all-hands meetings. Your toolbox adds professionalism to my slides. Instead of using standard clipart.
Claude Jones, Director of Engineer, @Walmartlabs, USA
I needed a fresh look at some of my slides. I've tried to find a way to create a paintbrush effect, to underline, accentuate, add some color and the handwritten markers were just the things. Very easy to use, easy to size, change the color. It was an affordable, perfect solution and I'm happy to recommend it.
Anonymous, US
The crisp, clean look of the graphics, and the fact that it allowed me to easily edit and change the colors to match the template was my main reason for purchasing them.
Brandie Jenkins, E-learning Developer, USA
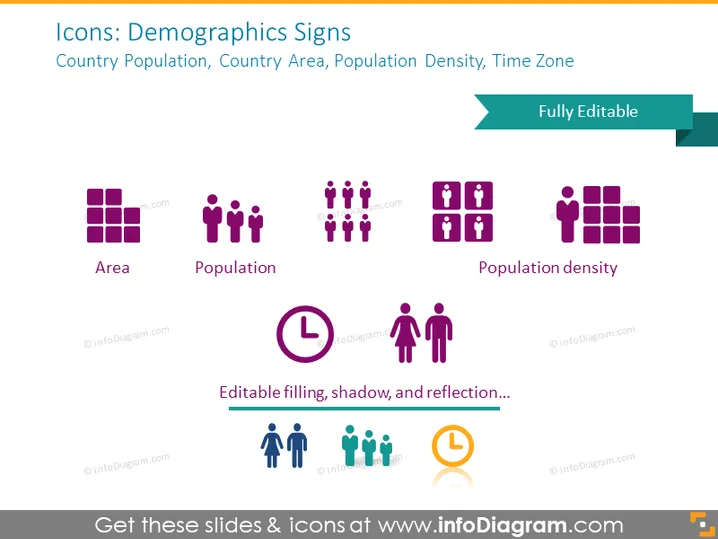
The slide presents a collection of demographic icons with labels that could be useful in various analytical contexts. The four icons—Area, Population, Population Density, and Time Zone—represent different demographic aspects. Area is illustrated by a grid, implying geographic measurement. Population is signified by a group of figures, referring to the count of individuals. Population Density associates a larger group of figures with a grid, symbolizing the number of people within a specific area. Time Zone is denoted by a clock face with a figure, indicating regions sharing the same standard time.
The slide has a clean and modern look with easily interpretable icons and a minimalistic color scheme that avoids overwhelming the viewer. The consistent use of color and simple graphics ensures the audience can quickly grasp the demographic concepts depicted.




