

Your graphics add a nice touch to my presentations and I recently used them for one of my all-hands meetings. Your toolbox adds professionalism to my slides. Instead of using standard clipart.
Claude Jones, Director of Engineer, @Walmartlabs, USA

Your graphics add a nice touch to my presentations and I recently used them for one of my all-hands meetings. Your toolbox adds professionalism to my slides. Instead of using standard clipart.
Claude Jones, Director of Engineer, @Walmartlabs, USA
I needed a fresh look at some of my slides. I've tried to find a way to create a paintbrush effect, to underline, accentuate, add some color and the handwritten markers were just the things. Very easy to use, easy to size, change the color. It was an affordable, perfect solution and I'm happy to recommend it.
Anonymous, US
The crisp, clean look of the graphics, and the fact that it allowed me to easily edit and change the colors to match the template was my main reason for purchasing them.
Brandie Jenkins, E-learning Developer, USA
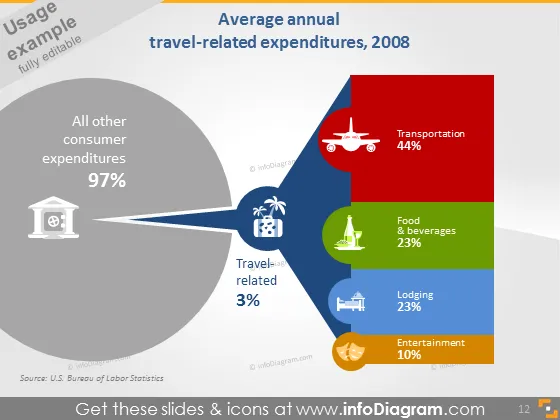
The slide presents a breakdown of travel-related expenditures in 2008, with a focus on the percentage of consumer spending that goes into travel. A large pie chart segment shows that 97% of all consumer expenditures are non-travel related, while a small sliver and adjacent area represent travel-related expenses at 3%. The latter is further broken down into categories such as Transportation (44%), Food & Beverages (23%), Lodging (23%), and Entertainment (10%), each implying how much of the travel budget was typically allocated to these areas.
The slide has a professional and clean design with a clear emphasis on visual data representation. The use of icons and varying color intensities for different categories aids in quickly conveying the relative expenses in each sector.



