

Your graphics add a nice touch to my presentations and I recently used them for one of my all-hands meetings. Your toolbox adds professionalism to my slides. Instead of using standard clipart.
Claude Jones, Director of Engineer, @Walmartlabs, USA

Your graphics add a nice touch to my presentations and I recently used them for one of my all-hands meetings. Your toolbox adds professionalism to my slides. Instead of using standard clipart.
Claude Jones, Director of Engineer, @Walmartlabs, USA
I needed a fresh look at some of my slides. I've tried to find a way to create a paintbrush effect, to underline, accentuate, add some color and the handwritten markers were just the things. Very easy to use, easy to size, change the color. It was an affordable, perfect solution and I'm happy to recommend it.
Anonymous, US
The crisp, clean look of the graphics, and the fact that it allowed me to easily edit and change the colors to match the template was my main reason for purchasing them.
Brandie Jenkins, E-learning Developer, USA
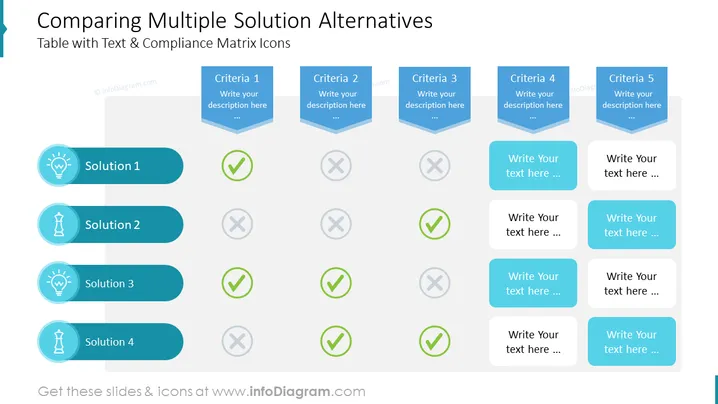
The PowerPoint slide titled "Comparing Multiple Solution Alternatives" features a matrix designed to evaluate and compare different solutions based on various criteria. There are four solution options listed, each accompanied by an icon, indicating a particular concept or aspect that the solution represents. The solutions are assessed against five criteria, marked with check (tick) or cross (X) icons, which depict whether each solution meets (check) or does not meet (cross) the respective criterion. Placeholder text boxes suggest that the user can input descriptions for each criterion and provide additional information for each solution.
The overall look of the slide is clean and modern, with a structured layout that clearly presents information. The color coding and iconography enhance visual communication and provide an easy-to-understand comparison of the solutions.
The slide is used to compare four different solutions against five criteria. Each solution is symbolized by a unique icon and is evaluated with checkmarks and crosses to signify compliance or exemption with each criterion. The user is prompted to add detailed descriptions for each criterion to further clarify the comparison. This setup allows for an at-a-glance assessment of how well each solution performs against the specified criteria.
The slide's background is a pale blue color, providing a neutral canvas for the content.
The title "Comparing Multiple Solution Alternatives" is prominently displayed at the top in dark blue text.
Each solution is introduced by a rounded horizontal banner in a darker shade of blue, featuring a white icon on the left and titled "Solution 1" through "Solution 4."
A vertical list of five criteria is arranged next to the solutions, each criterion presented in a 3D isometric blue box with space for a description.
A grid of checkmarks and crosses follows, aligned horizontally with the solutions and vertically with the criteria, indicating whether the criteria are met or not.
The checkmarks are green and the crosses are red, creating a clear visual distinction for easy comparison.
In the footer area, there is a color legend explaining the significance of the checkmarks and crosses.
The slide has a crisp, professional appearance with a well-organized layout. The use of icons and color-coded markers effectively aids in quick visual assessment and comparison of the data.
Presenting strategic business analyses, highlighting the strengths and weaknesses of different strategies or solutions.
Use during team meetings or workshops to facilitate discussions about which solutions best meet project requirements.
Comparison slides in sales pitches to demonstrate the superiority of a product or service over competitors.
Educational settings to teach students about decision-making processes and evaluative criteria in business scenarios.



