
Your graphics add a nice touch to my presentations and I recently used them for one of my all-hands meetings. Your toolbox adds professionalism to my slides. Instead of using standard clipart.
Claude Jones, Director of Engineer, @Walmartlabs, USA
Your graphics add a nice touch to my presentations and I recently used them for one of my all-hands meetings. Your toolbox adds professionalism to my slides. Instead of using standard clipart.
Claude Jones, Director of Engineer, @Walmartlabs, USA
I needed a fresh look at some of my slides. I've tried to find a way to create a paintbrush effect, to underline, accentuate, add some color and the handwritten markers were just the things. Very easy to use, easy to size, change the color. It was an affordable, perfect solution and I'm happy to recommend it.
Anonymous, US
The crisp, clean look of the graphics, and the fact that it allowed me to easily edit and change the colors to match the template was my main reason for purchasing them.
Brandie Jenkins, E-learning Developer, USA
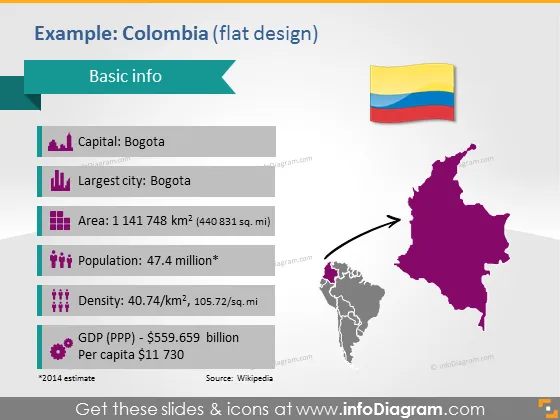
The PowerPoint slide is titled "Example: Colombia (flat design)" and contains "Basic info" about Colombia. It lists the capital as Bogota, which is also the largest city. The area is presented as 1,141,748 square kilometers, indicating the vastness of the country. It notes the population at 47.4 million, underscoring a significant number of inhabitants. The population density is specified as 40.74/km^2, providing an understanding of how spread out the population is. Additionally, it details the GDP (PPP) as $559,659 billion and a per capita income of $11,730, pointing to economic indicators.
The slide is structured with clear, concise information paired with vibrant icons and maps to provide visual emphasis. The flat design ensures it looks modern and easily readable.




