

Your graphics add a nice touch to my presentations and I recently used them for one of my all-hands meetings. Your toolbox adds professionalism to my slides. Instead of using standard clipart.
Claude Jones, Director of Engineer, @Walmartlabs, USA

Your graphics add a nice touch to my presentations and I recently used them for one of my all-hands meetings. Your toolbox adds professionalism to my slides. Instead of using standard clipart.
Claude Jones, Director of Engineer, @Walmartlabs, USA
I needed a fresh look at some of my slides. I've tried to find a way to create a paintbrush effect, to underline, accentuate, add some color and the handwritten markers were just the things. Very easy to use, easy to size, change the color. It was an affordable, perfect solution and I'm happy to recommend it.
Anonymous, US
The crisp, clean look of the graphics, and the fact that it allowed me to easily edit and change the colors to match the template was my main reason for purchasing them.
Brandie Jenkins, E-learning Developer, USA
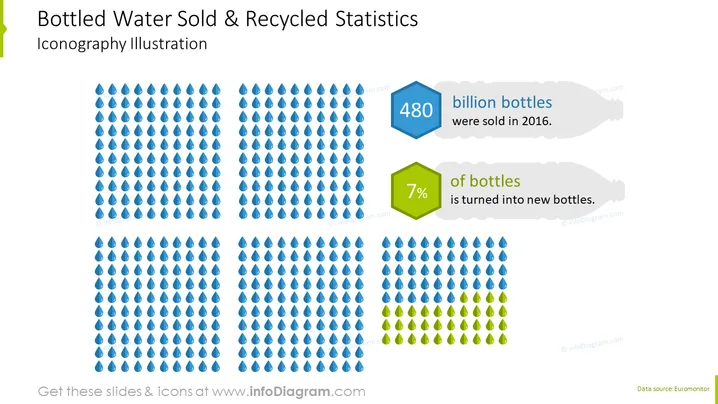
The PowerPoint slide presents statistics about bottled water sales and recycling. It reports that in 2016, 480 billion bottles were sold, and only 7% of these bottles were recycled into new bottles. Each percentage point is represented visually with icons, highlighting the contrast between the total sold and the relatively small fraction that undergoes recycling.
The slide has a clean, professional look with a clear visual hierarchy that emphasizes the key statistics. The use of icons and color-coding effectively communicates the vast difference between the number of bottles sold and recycled.
Such a slide would be useful in business presentations focused on environmental impact, sustainability reports, or in a pitch for a recycling initiative. It could also serve to illustrate market potential in the recycling industry or in educational settings to raise awareness about recycling.



