
Your graphics add a nice touch to my presentations and I recently used them for one of my all-hands meetings. Your toolbox adds professionalism to my slides. Instead of using standard clipart.
Claude Jones, Director of Engineer, @Walmartlabs, USA
Your graphics add a nice touch to my presentations and I recently used them for one of my all-hands meetings. Your toolbox adds professionalism to my slides. Instead of using standard clipart.
Claude Jones, Director of Engineer, @Walmartlabs, USA
I needed a fresh look at some of my slides. I've tried to find a way to create a paintbrush effect, to underline, accentuate, add some color and the handwritten markers were just the things. Very easy to use, easy to size, change the color. It was an affordable, perfect solution and I'm happy to recommend it.
Anonymous, US
The crisp, clean look of the graphics, and the fact that it allowed me to easily edit and change the colors to match the template was my main reason for purchasing them.
Brandie Jenkins, E-learning Developer, USA
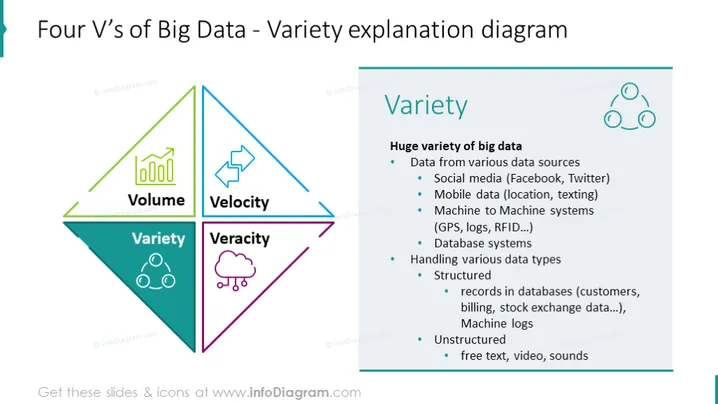
This slide examines 'Variety' within the Four V’s of Big Data, illustrating the wide range of data types and sources. It covers data from social media platforms like Facebook and Twitter, mobile data including location and texting, and machine-to-machine systems such as GPS and RFID. It also distinguishes between structured data found in databases like customer records and unstructured data such as text, video, and sound, emphasizing the complexity of handling diverse data forms.
The slide is designed with a crisp and clear aesthetic, using a color-coded central graphic to highlight the 'Variety' aspect of Big Data. Icons are used to visually associate with the textual content, creating an engaging and informative display.




