

Your graphics add a nice touch to my presentations and I recently used them for one of my all-hands meetings. Your toolbox adds professionalism to my slides. Instead of using standard clipart.
Claude Jones, Director of Engineer, @Walmartlabs, USA

Your graphics add a nice touch to my presentations and I recently used them for one of my all-hands meetings. Your toolbox adds professionalism to my slides. Instead of using standard clipart.
Claude Jones, Director of Engineer, @Walmartlabs, USA
I needed a fresh look at some of my slides. I've tried to find a way to create a paintbrush effect, to underline, accentuate, add some color and the handwritten markers were just the things. Very easy to use, easy to size, change the color. It was an affordable, perfect solution and I'm happy to recommend it.
Anonymous, US
The crisp, clean look of the graphics, and the fact that it allowed me to easily edit and change the colors to match the template was my main reason for purchasing them.
Brandie Jenkins, E-learning Developer, USA
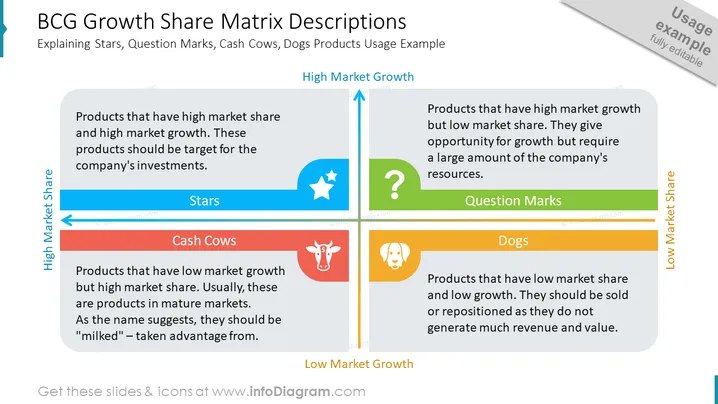
The slide is focused on explaining the four categories of the Boston Consulting Group (BCG) Growth-Share Matrix: Stars, Question Marks, Cash Cows, and Dogs. Stars represent products with high market share and growth, ideal for investment. Question Marks have high growth but low market share, requiring significant resources. Cash Cows have a high market share but low growth, indicating they should be leveraged for profit. Dogs have low market share and growth, suggesting they should be sold or repositioned due to their limited revenue potential.
The overall look of the slide is clear and colorful, with a professional layout designed to facilitate easy understanding of the BCG Matrix concepts. The use of icons and bold colors in the quadrants aids in visual differentiation of each category.



