
Your graphics add a nice touch to my presentations and I recently used them for one of my all-hands meetings. Your toolbox adds professionalism to my slides. Instead of using standard clipart.
Claude Jones, Director of Engineer, @Walmartlabs, USA

Your graphics add a nice touch to my presentations and I recently used them for one of my all-hands meetings. Your toolbox adds professionalism to my slides. Instead of using standard clipart.
Claude Jones, Director of Engineer, @Walmartlabs, USA

I needed a fresh look at some of my slides. I've tried to find a way to create a paintbrush effect, to underline, accentuate, add some color and the handwritten markers were just the things. Very easy to use, easy to size, change the color. It was an affordable, perfect solution and I'm happy to recommend it.
Anonymous, US
The crisp, clean look of the graphics, and the fact that it allowed me to easily edit and change the colors to match the template was my main reason for purchasing them.
Brandie Jenkins, E-learning Developer, USA
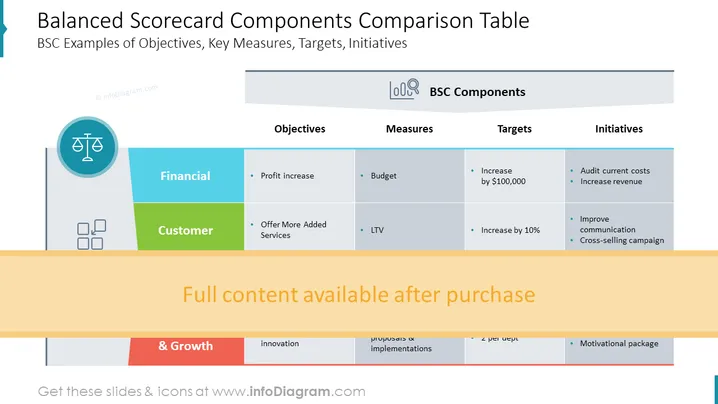
This PowerPoint slide presents a Balanced Scorecard (BSC) Components Comparison Table, focusing on different aspects such as Financial and Customer perspectives. Under Financial, the objectives include a profit increase, and corresponding measures like budgeting are mentioned, along with a target of increasing by $100,000 and initiatives such as auditing current costs and increasing revenue. For the Customer section, the objective is to offer more added services, measured by LTV (Lifetime Value), with a target to increase by 10%, and initiatives like improving communication and a cross-selling campaign.
The overall look of the slide is professional and organized, utilizing color coding to distinguish different categories and iconography to enhance visual understanding. The structured layout facilitates quick comprehension of complex business concepts.


