

Your graphics add a nice touch to my presentations and I recently used them for one of my all-hands meetings. Your toolbox adds professionalism to my slides. Instead of using standard clipart.
Claude Jones, Director of Engineer, @Walmartlabs, USA

Your graphics add a nice touch to my presentations and I recently used them for one of my all-hands meetings. Your toolbox adds professionalism to my slides. Instead of using standard clipart.
Claude Jones, Director of Engineer, @Walmartlabs, USA
I needed a fresh look at some of my slides. I've tried to find a way to create a paintbrush effect, to underline, accentuate, add some color and the handwritten markers were just the things. Very easy to use, easy to size, change the color. It was an affordable, perfect solution and I'm happy to recommend it.
Anonymous, US
The crisp, clean look of the graphics, and the fact that it allowed me to easily edit and change the colors to match the template was my main reason for purchasing them.
Brandie Jenkins, E-learning Developer, USA
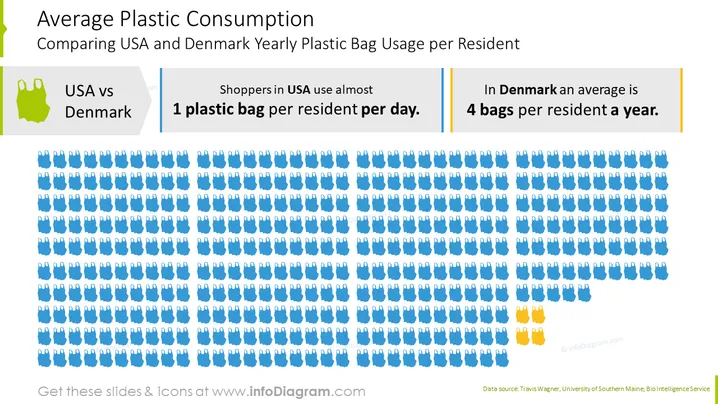
The PowerPoint slide compares the annual plastic bag consumption per resident between the USA and Denmark. It illustrates that shoppers in the USA use nearly 1 plastic bag per resident each day, whereas in Denmark, the average is only 4 bags per resident per year. This stark contrast serves to highlight the differences in consumer behavior and environmental impact between the two countries.
The visual design of the slide is straightforward and uses iconography to convey the vast difference in plastic bag usage between the two countries. The contrasting colors and the sheer number of icons effectively illustrate the message.
This slide could be used in environmental presentations to discuss consumer habits, in policy-making sessions to advocate for reducing plastic usage, or in marketing meetings to strategize on promoting eco-friendly products. It is also useful for educational purposes to raise awareness about sustainable practices.



