
Your graphics add a nice touch to my presentations and I recently used them for one of my all-hands meetings. Your toolbox adds professionalism to my slides. Instead of using standard clipart.
Claude Jones, Director of Engineer, @Walmartlabs, USA

Your graphics add a nice touch to my presentations and I recently used them for one of my all-hands meetings. Your toolbox adds professionalism to my slides. Instead of using standard clipart.
Claude Jones, Director of Engineer, @Walmartlabs, USA

I needed a fresh look at some of my slides. I've tried to find a way to create a paintbrush effect, to underline, accentuate, add some color and the handwritten markers were just the things. Very easy to use, easy to size, change the color. It was an affordable, perfect solution and I'm happy to recommend it.
Anonymous, US
The crisp, clean look of the graphics, and the fact that it allowed me to easily edit and change the colors to match the template was my main reason for purchasing them.
Brandie Jenkins, E-learning Developer, USA
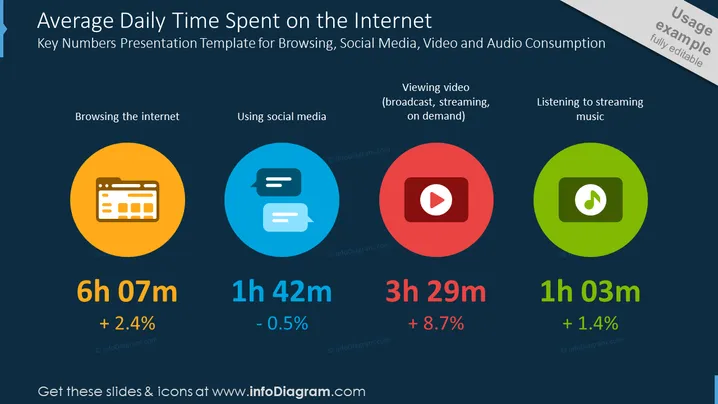
The slide presents statistics about the average daily time spent on various internet activities. Browsing the internet accounts for 6 hours 7 minutes, an increase of 2.4%. Using social media takes up 1 hour 42 minutes, which sees a slight decline of 0.5%. Watching videos, including broadcasts and streaming, is at 3 hours 29 minutes with a significant rise of 8.7%. Lastly, listening to streaming music is 1 hour 3 minutes, marking a growth of 1.4%.
The slide is neatly organized and uses vibrant colors to contrast sharply against the dark background, making the information stand out. The use of well-known symbols makes the content immediately recognizable.


